
Fill Rate B2B B2C

Are aiming to increase your organization selling opportunities and Market share?
Are you aiming to increase your growth and profitability?
Fill Rate is another efficiency key performance measure you can establish and track to optimize your supply chain operations. Fill Rate is a measure the service and availability level between two parties. It is the portion of the Customer demand that could be serviced through product availability without having lost sales or backorders.
➤ Fill Rate is calculated by averaging the correctly fulfilled orders relative to the total number of customer orders received.
➤ Measuring and monitoring Fill Rate will allow your company to Improve your inventory and supply processes and directly affect your customer satisfaction.
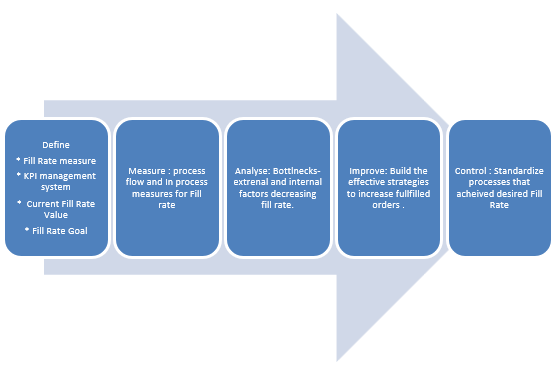
Chools competent team of consultants will guide you in establishing; Fill rate Key performance Measure and the effective performance management system (measuring, tracking and improving), measure your current Fill rate and set your fill Rate goal. This will be integrated with using the DMAIC methodology.
Why Useful?
✔ Leadership Team: An efficient Measure for effective Decision Making
✔ Sales: A Measure for the performance of Sales team and sales results
✔ Process: A Measure for Performance of Inventory and Supply.
✔ Customer: Ensure customer satisfaction of order fulfillment by Improving Fill rate measure.
✔ Shareholders: Increase Market Share and thus organization profitability.
Our Methodology
A Client Success Story:
Case
Chools Partnered with a startup that now is a leader in the Furniture business in Midwest North America.
Not too long after they established their Ecommerce Website, New branding, and displayed their products through other Market places such as Amazon and Wayfair, that they were hit by the complexity of warehousing and shipping for their online orders.
Act
Chools team started by guiding the organization in:
✔ Establishing the Fill Rate performance management system.
✔ Measure the current SKU and Value fill rate
✔ Identify the desired SKU and Value Fill Rate with Shareholders in order to achieve NOPBT.
✔ Created a process flow with contributors starting with vendors and sources processes, to processing and ordering process to inventory and distributions.
✔ Analyzed the added value versus non added value steps, what could be streamlined and automated.
✔ Improved the process and the Fill rate measure through Designing an Order fulfillment process and center, and digitized it and automated the ordering process via introducing an ERP and designed the inventory and vendor Management process.
Results
“ Chools equipped us to build the right strategy to improve our SKU and Value Fill Rate , consequently, expand our sales channels and reach more customers through e-commerce so that our Sales Revenue increased by 41%. Through tracking our Fill rate and working continuously to improve, we were able to exceed our customer expectations and deliver our products within two day and enhanced the fill rate from 75% to 90% in one year. Moreover, through optimizing the process we have enhanced our Labor productivity by 10% Unit/EE-HR and reduced working capital by 15%.”
Fill Rate B2B B2C - Case Study
Case
Chools Partnered with a startup that now is a leader in the Furniture business in Midwest North America.
Not too long after they established their Ecommerce Website, New branding, and displayed their products through other Market places such as Amazon and Wayfair, that they were hit by the complexity of warehousing and shipping for their online orders.
Solution
Chools team started by guiding the organization in:
➤ Establishing the Fill Rate performance management system.
➤ Measure the current SKU and Value fill rate
➤ Identify the desired SKU and Value Fill Rate with Shareholders in order to achieve NOPBT.
➤ Created a process flow with contributors starting with vendors and sources processes, to processing and ordering process to inventory and distributions.
➤ Analyzed the added value versus non added value steps, what could be streamlined and automated.
➤ Improved the process and the Fill rate measure through Designing an Order fulfillment process and center, and digitized it and automated the ordering process via introducing an ERP and designed the inventory and vendor Management process.
Results
“ Chools equipped us to build the right strategy to improve our SKU and Value Fill Rate , consequently, expand our sales channels and reach more customers through e-commerce so that our Sales Revenue increased by 41%. Through tracking our Fill rate and working continuously to improve, we were able to exceed our customer expectations and deliver our products within two day and enhanced the fill rate from 75% to 90% in one year. Moreover, through optimizing the process we have enhanced our Labor productivity by 10% Unit/EE-HR and reduced working capital by 15%.”
Case
A Liquid Hand Soap Manufacturer with an annual production of 255MM tons started observing a decline in its Sales revenue. The company was aiming to increase its revenue and increase its profitability through driving cost reduction and continuous improvement initiatives. Our team started with conducting a Deep Dive analyzing the revenue model, Market channels, product accuracy, Go to Market or Delivery time.
Solution
The first action taken by our consultants was measuring the Fill Rate, which was 41%. With this low Fill rate, our team conducted a Value stream mapping to study the opportunities and gaps. The following was identified:
Truck Loading Process exceeds standard time by 30min causing delivery time delays and an inaccuracy in product loading causing costumers’ loss and additional markets routes.
The following solutions were executed:
➤ 3 Forks Forklifts were used instead to carry two pallets vs. One
➤ Trucks were modified to carry more pallets.
➤ Automation of PO process by introducing ERP/SAP which connected all stakeholders, customers, manufacturing operations and vendors, warehouses and sales and distribution. This drove accuracy in recording customers’ orders and instant visibility to the orders by the Warehouses team giving time for order preparation and reducing human error in communicating the order and manual papers.
➤ Elimination of the Gate inspection process reducing time of delivery.
➤ Training of loading warehouse team to meet criteria of loading.
➤ Optimization of truck delivery routes and scheduling based on geography, which also reduced fuel costs.
➤ Introduce a tool for unloading cases from truck to customer to reduce the time, enhance ergonomics.
➤ Enhance product storage and 5S in the Warehouses for easy and speedy allocation of product by forklift drivers loading trucks.
Result:
Over a course of a year, the producer increased its fill rate to 75%, Sales revenue by 22%, reduced the total $Cost /case by 11% and met the AOP for S&D cost of $0.1 $/case. In addition, Employee productivity Case/EE-Hr. increased by 31% and initiatives enhanced Employee Safety related to Ergonomics.
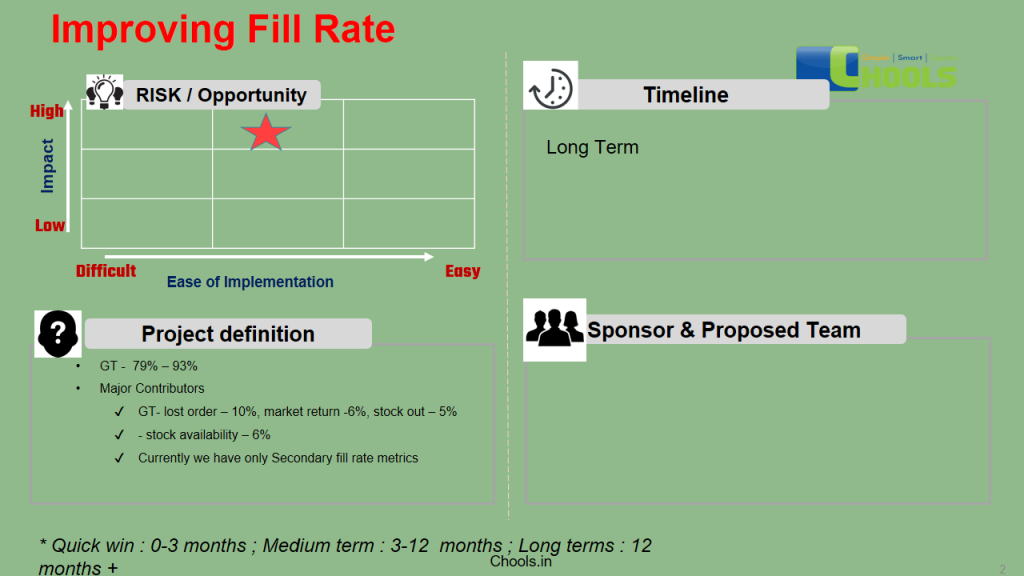
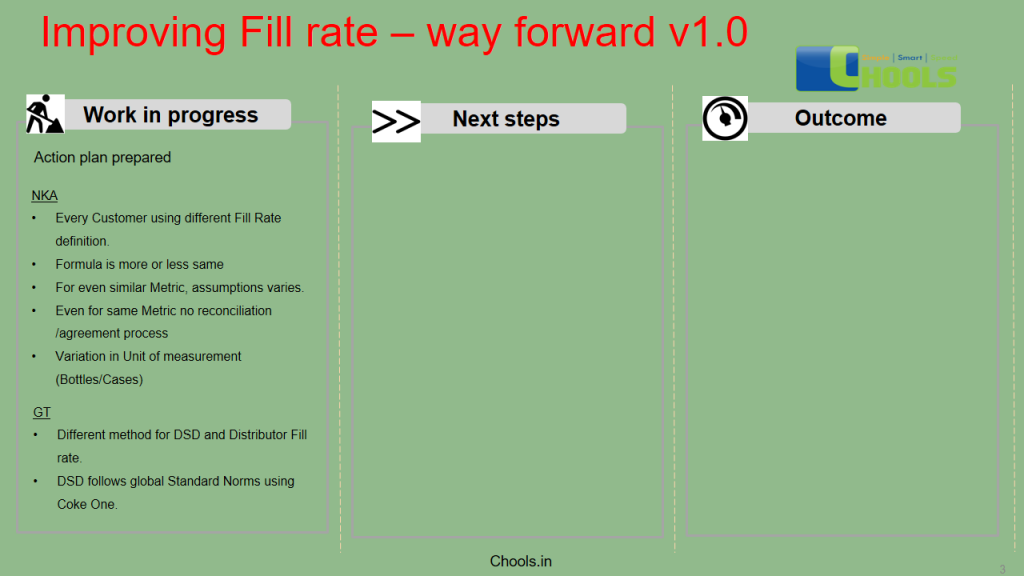
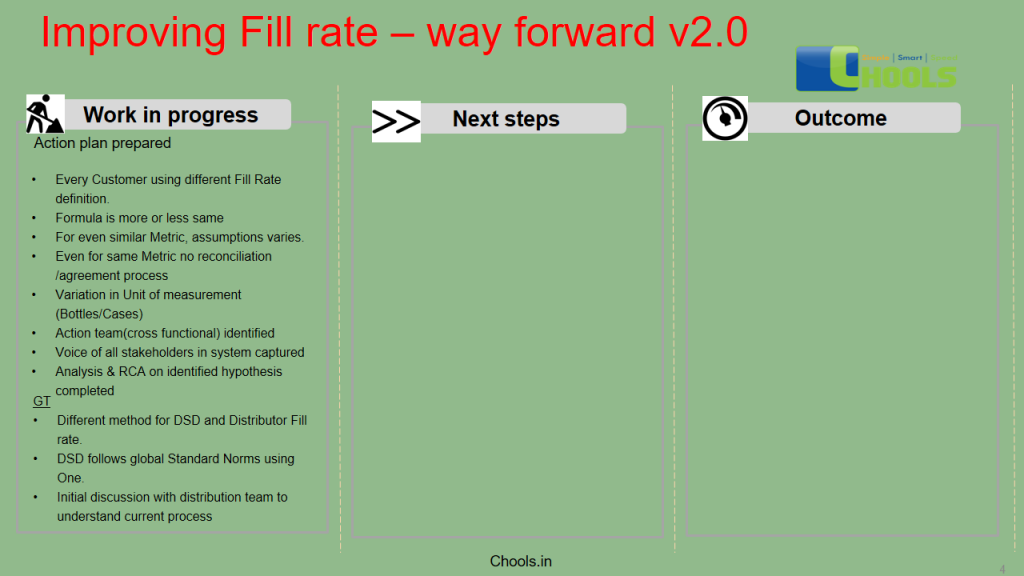

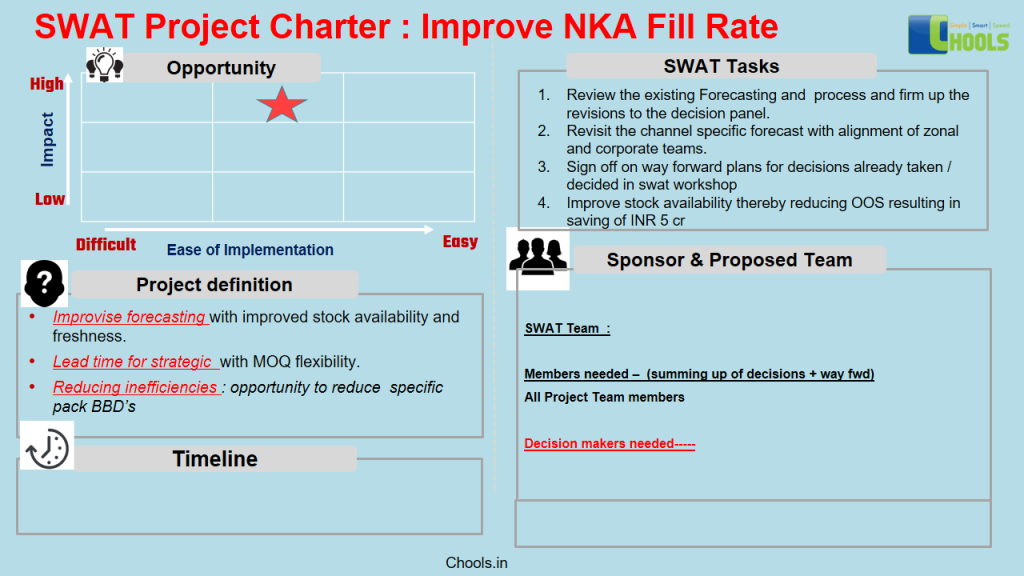
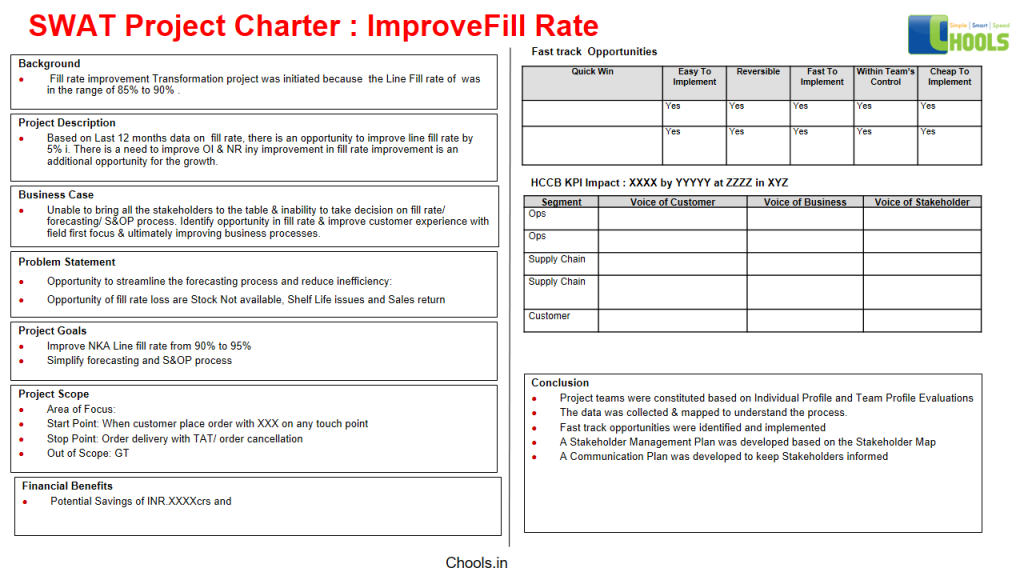
SWAT FILL RATE ACTION PLAN