
Introduction
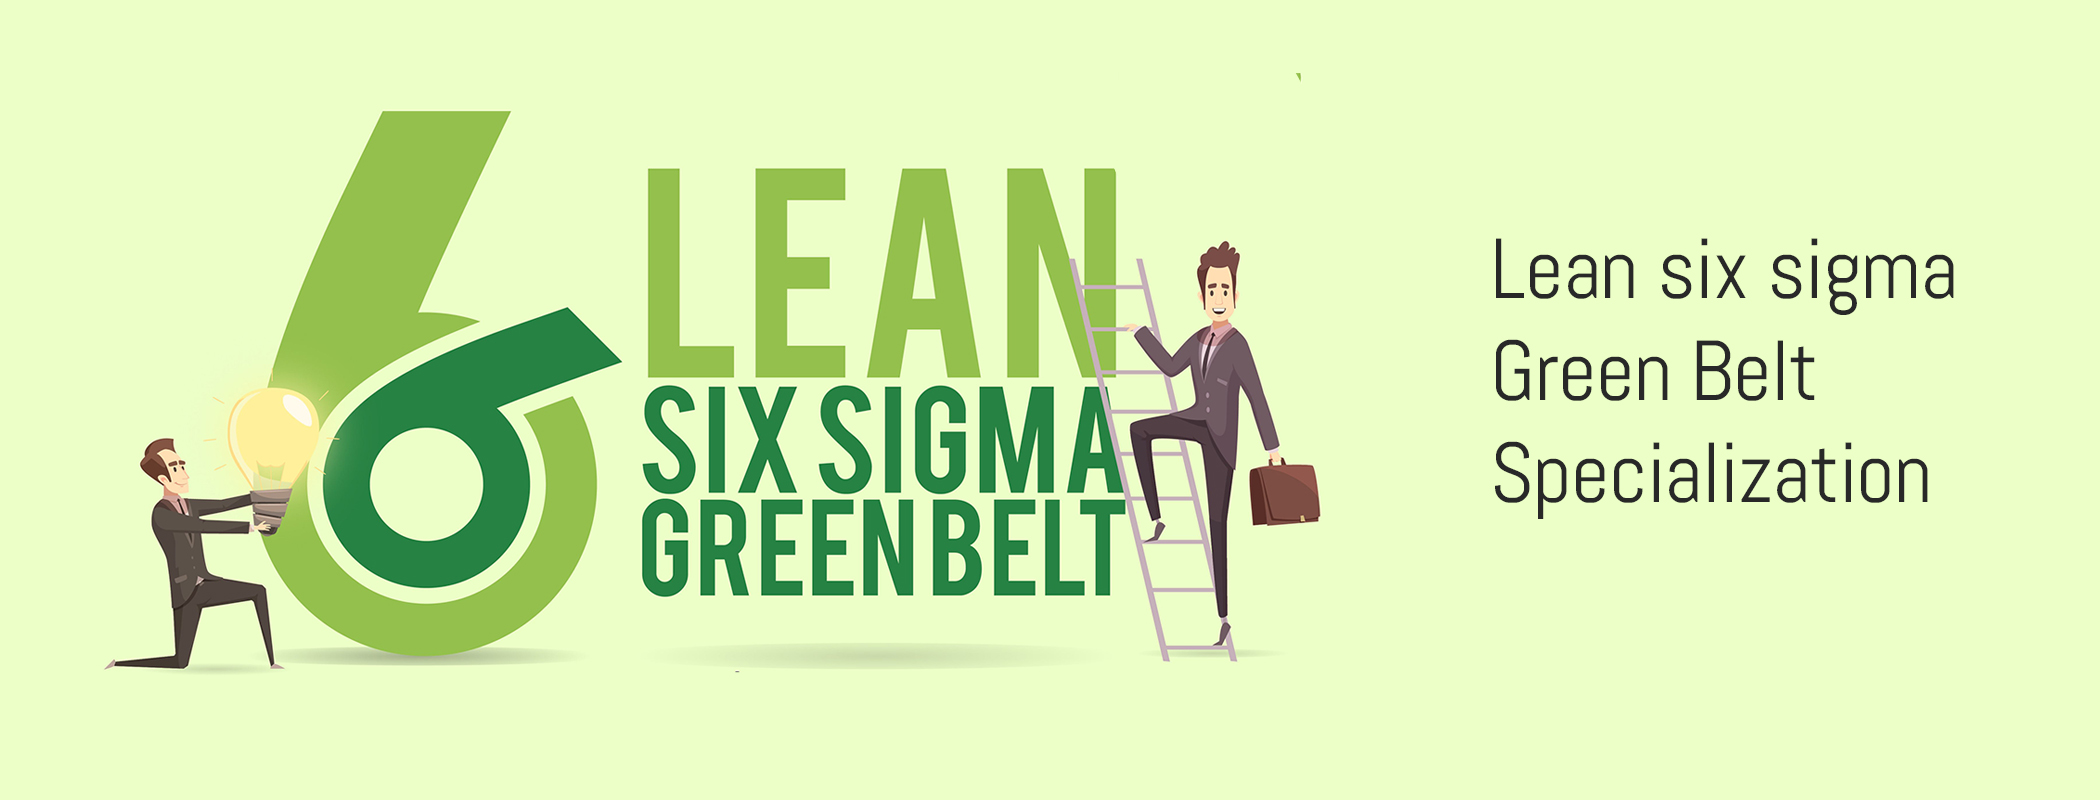
Green Belt is a management qualification for problem solving competence. It includes world’s best problem-solving methods in a single capsule. Professionals who wish to solve business problems using a structured approach can benefit from Lean Six Sigma Green Belt.
Course Duration : 4 weeks @ 5-10 hours / week
Skills
You’ll Gain
➤ You learn about the world’s best techniques in problem-solving. You go through methods to define a problem, measure the extent, find the root cause of a problem, generate solutions, and implement control systems.
➤ The program emphasizes sustainable methods of problem-solving aided by data-driven techniques.
➤ There are two broad categories of problems that get covered. Issues related to big turnaround time and those about defects/ errors/ complaints/non-compliances.
➤ Black Belt certification course after completing the Green Belt Certification.
The Internet’s statistics says that the Six Sigma Green Belt certification holder salary, on an average is $83,000 per year as of year 2021, as compared to a non-certified person, who would earn approximately $65,000 per year in 2021.
Is this
course for you?
Participants can be:
➤ Anyone who wants to improve an Organisation’s performance.
➤ Process Improvement team members who wish to carry out improvement projects.
➤ Any progressive management professional who wants to bring change for the better.
Course Pre-requisites
An Open Mind and Willingness to Learn World’s Best Methods for Problem Solving
Curriculum
Define Measure and Solve problems
- Selecting a project
- Project Charter Introduction to MSA
- Attribute agreement analysis
- Brainstorming
- Poka yoke Control Plan
Root Cause Analysis
- Fishbone Affinity, 5 Why, Pareto Analysis
- Process FMEA
- Value Add/ Non-Value Add Analysis
- Sampling methods. Hypothesis Testing Common hypothesis tests and their practice
- Scatter Diagram, correlation, and Regression
Statistics, Process Stability and Capability
- Types of data, measures of central tendency & spread
- Descriptive Statistics
- Graphical tools
- Common cause, Special cause, Control chart
- Specification Limits
- Sigma Level as a metric, Z table and DPM
- Pp and Ppk analysis
- Defects vs Defectives
- Baseline for discrete data
- Yield and Rolled Throughput Yield
Course Brochure
Testimonials By Our Students
Chools GEMS
Request for DEMO