Supply Chain Metrics & Benchmarking
➤ The Complexity of global supply chain is growing more and more every day. Agility and Resilience driven by the right strategies is the way to overcome this complexity. The first step to putting in place the right strategies is developing the right Metrics, which should be followed by benchmarking your organization with world-class performance supply chain operations.
➤ Chools competent team of consultants will guide you in establishing A successful Metric systems: Collecting, Monitoring and Improving the right key performance measures and putting in place the right benchmarking strategies: Internal, external and Competitive.
➤ Following our Capability and Impact Assessments integrated with SWOT and PEST Analysis, we form your Y-Chart including your SMART goals to develop the Metric and benchmarking strategy.
Predicted Gains:
➤ Achieve Operational Excellence and Competitive advantage by:
✔ Introducing a demonstrated Performance Management Journey
✔ Stimulating a Results Oriented Mind-set among the whole organization, which advances your vision of World Class Operations.
✔ Introducing a demonstrated Benchmarking Strategy.

Our Methodology:
➤ We Guide your team in establishing your Performance management journey, which includes:
✔ Identify the basic responsibilities that are controlled by field operations
✔ Standardize data collection processes for Key performance measures. (KPM’s)
✔ Track KPM’s, which drive business success.
✔ Found databased primacies, based on the results of the KPM’s.
✔ Exploit performance with the current resources.
✔ Sustain performance progresses through standardization
✔ Methodically improve the work to reach World Class Levels through Benchmarking: External, Internal or competitive.
We establish the Performance through 4 stages:
➤ Stage 1: Preparing for Measures
- Data Collection
➤ Stage 2: Measuring Performance
- Measure Calculation and Results Analysis and Tracking
➤ Stage 3: Performance Improvement
- Goal Transformation and Coaching
➤ Stage 4: Visualizing the Operations
A Featured Client Story:
➤ Chools guided a Leading FMCG in the Middle East to develop its supply chain Performance management journey and Metric system,
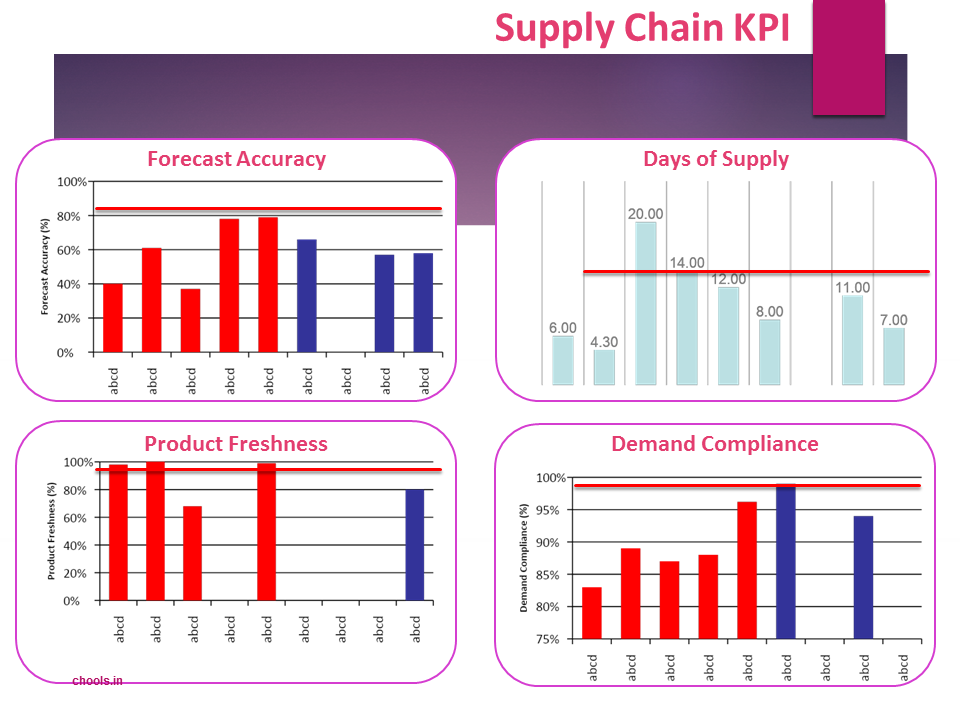
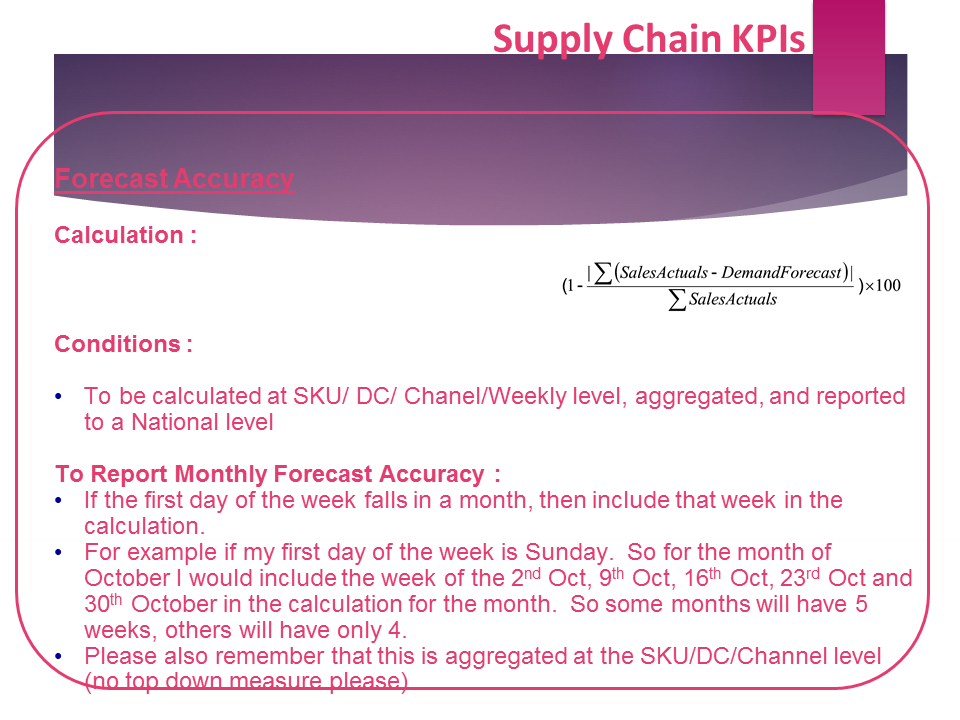
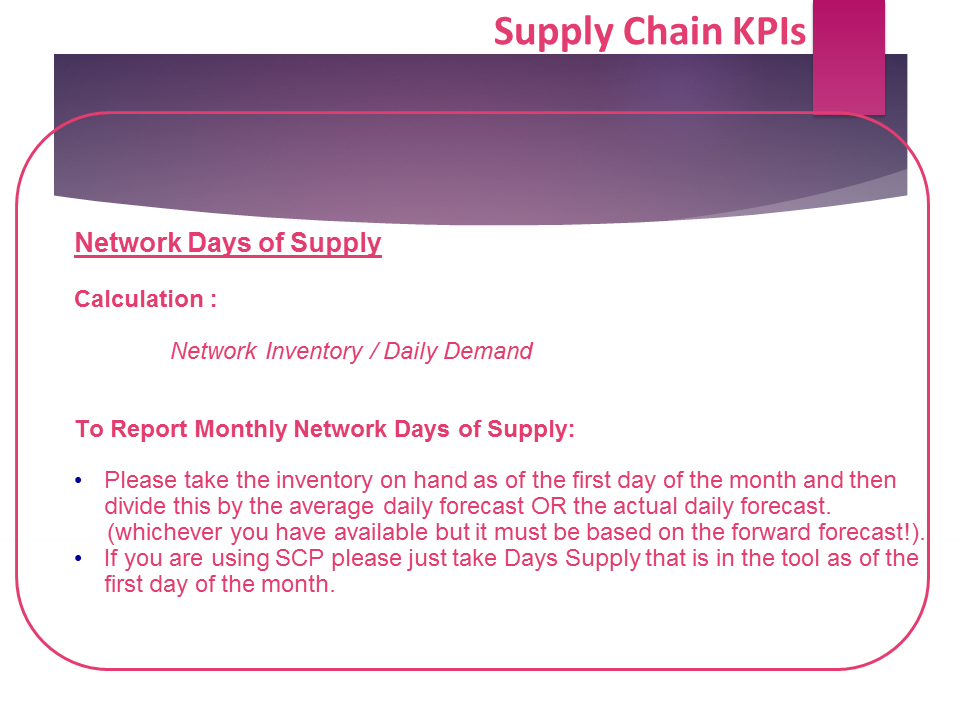
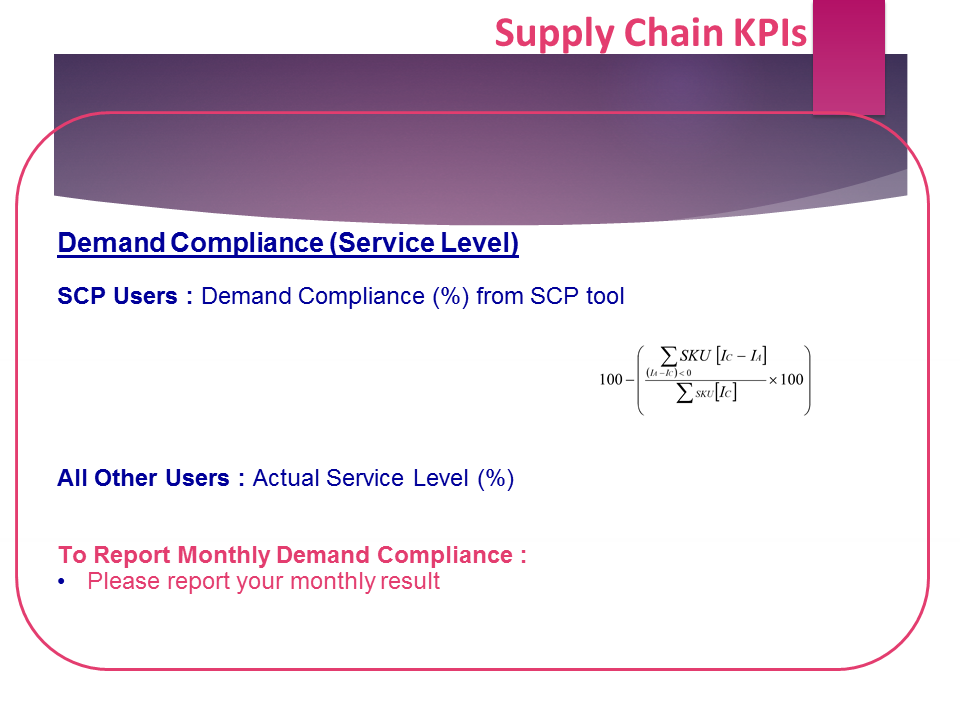
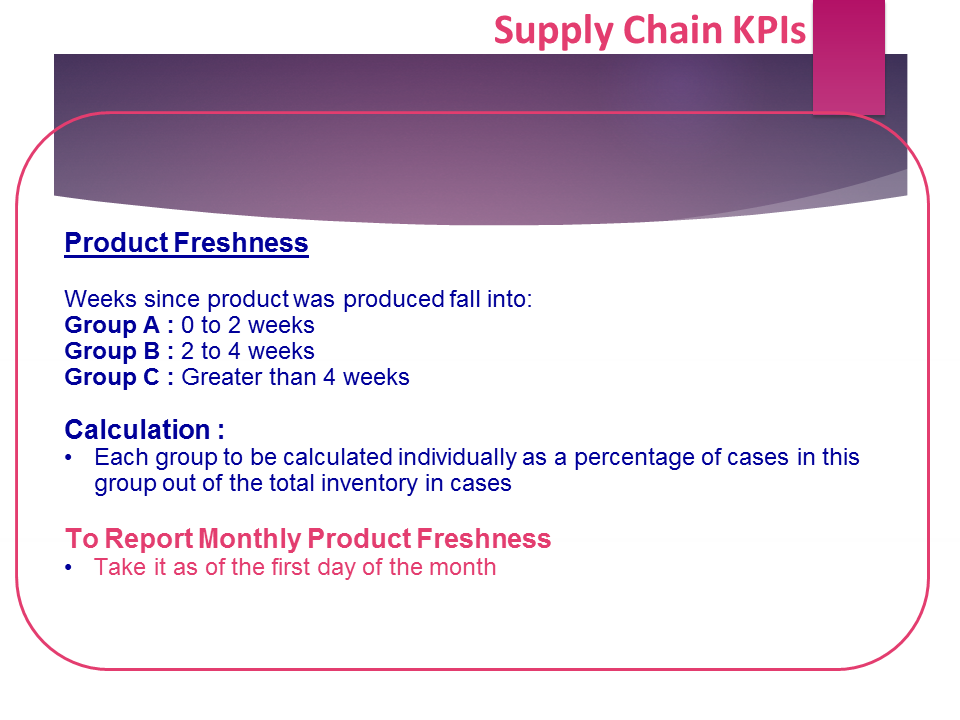
➤ Key Performance Measures developed to drive operational excellence were:
✔ Forecast Accuracy percentage
✔ Network number of days
✔ Demand Compliance percentage
✔ Product Freshness
✔ Days in Inventory.
➤ The performance management system developed to track and improve those KPM’s followed by competitive Benchmarking led to the realization of the Supply chain Org.
➤ Visualization, building the capabilities of the team, establishing daily management systems including Supply chain and operations (S&OP), and automating the Database collection system and sharing; leveraging SAP (ERP) were crucial key success factors.
Our Methodology
Seven best In class 7 Supply Chain Strategies-
Strategy # 1: Embrace a business planning operating Model that is driven by real time Market Demand ( AI and IoT).
Strategy # 2: Develop a resilient organization reacting with agility to market demand in integrated planning and production.
Strategy # 3: Embrace Innovation and Design Methodologies to optimize Products and Processes: Manufacturing- Supply and Sustainability (Design thinking, DFSS).
Strategy # 4: Align all business goals by integrating Supply Chain, Sales, Corporate business planning and operations planning (S&OP and SC control tower).
Strategy # 5: Incorporate Environmental and Social Sustainability in Supply chain Operations (Corporate social responsibility, Carbon Foot prints, Energy usage etc.)
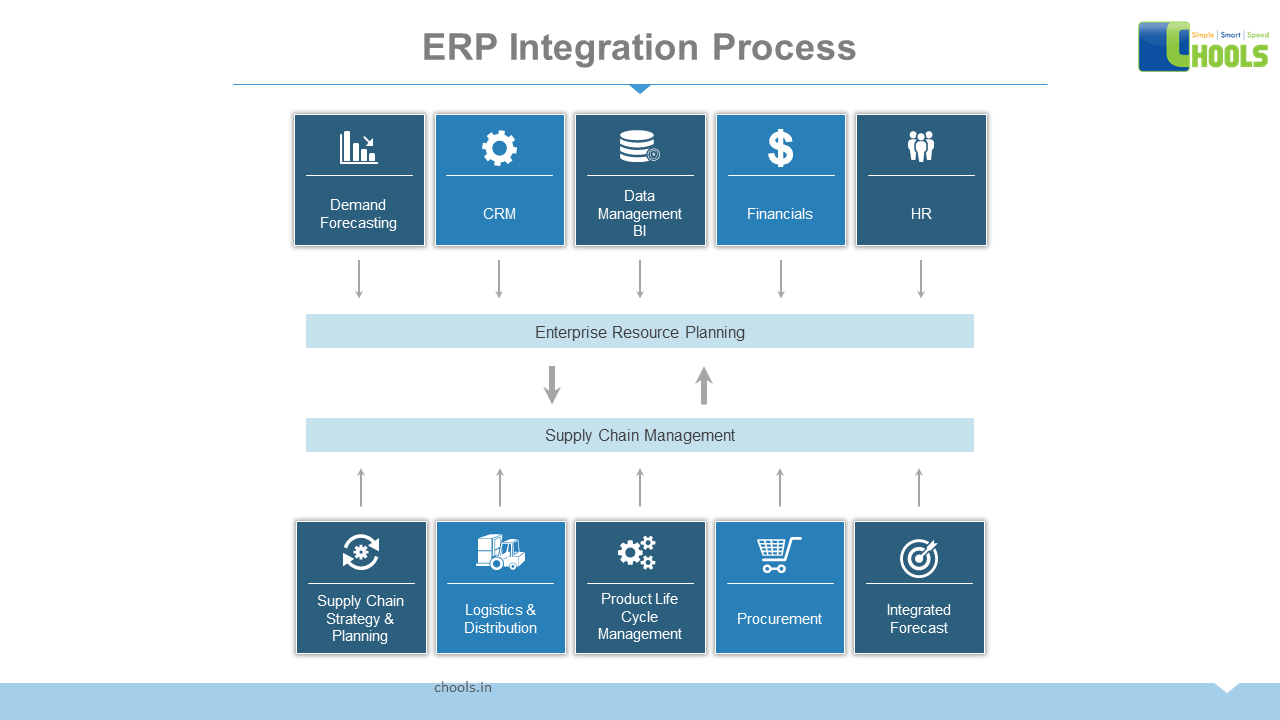
Strategy # 6: Adopt technologies (Data base Networks, Enterprise Resource Planning, and Artificial intelligence, SC control tower) to ensure predictable operations.
Strategy # 7: Establishing a supplier partnership relationship.
Related Case Study:

Case : Chools was hired by 100 fortune Food and beverage company in North India to drive and develop its supply chain excellence Journey .

Act : Chools Consultants conducted Supply chain assessments, SWOT and impact analysis; followed by Developing the Y- chart and implementing the 7 Best in Class Strategies.

Results : – $3MM annual productivity was achieved – 3% of supply chain base spend; delivered through reduction in transportation , excess inventory, Labor cost and Operations otimization. 21% Increase in sales Revenue was captured.
Supply Chain Metrics & Benchmarking - Case Study
The Challenge
A prominent food and beverage company was under pressure from its customers regarding several aspects. Lead times had to be reduced, competitive prices had to be adopted, service levels had to be improved and product freshness had to be increased. A more holistic view of its supply chain operations had to be incorporated.
The client’s business comprised several factories, the production requirements were centrally managed. The production in factories incremented in shifts. Critical items were prioritized based on a monthly forecast. Multiple locations could produce only 35% of the SKUs. The production constraints also included labor balancing, full shift increments and shared equipment. Additionally, the client also suffered from high transportation costs.
The Solutions
Chools Lean deployment team clearly defined the supply chain implications of shifting to a flexible, regional production effort.
The outlined goals for the project were:
✔ Aligning production strategy with regional sales.
✔ Understanding the steps to achieve the future state.
✔ Engaging team members to implement the future state.
✔ Changing the culture. Shifting the mental modes. Aligning staff.
✔ Minimizing the total delivered costs.
✔ Reducing the lead times and inventories
Chools came up with a Total Delivered Cost Model. It simulated the effects of adjusting certain supply chain variables. Those included supplier order-to-delivery lead time, supplier shipment frequency, production frequency, change over cost and time, batch size production amount and order-to-production lead time. More than 200 data points were used. Output measurements had entities like cost points, inventory impacts, cross-shipment amounts and lead time impacts.
The lean Awareness workshop was conducted by Chools for team members to get a better understanding of Lean Supply Chain, rigorous “Go-See” activities and “Make-To-Order” constraints. The workshop trained team members on Lean principles and Problem Solving. Chools collaborated with the client in improving its scorecard process and shared best practices on different Lean topics.
The Results
With Chools Total Delivered Cost Model of the supply chain, the client had a clear definition of the value proposition of lean principles in supply chain concerning with its make-to-order vision. Impacts of various systems were accurately estimated by it. It identified implications for potential future state scenarios. With it, SKUs were validated to pilot. It was followed by identifying changeable parameters for implementation. The flow of materials was increased, inventories were reduced, customer fill rates were increased and the total delivered cost of producing finished goods was reduced.
The Challenge
➤ A packaged food giant with global operations spanning major countries of different continents had built a strong brand presence. They had gained consumer trust and were known for fostering product innovation. Despite their overwhelming sales growth generated by novel products, the client faced supply chain issues threatening their profitability. Majorly highlighted were the rising commodity costs, supply chain disruptions and an identified case of food contamination. The client was looking for an effective solution to maintain its market leadership, simultaneously ensuring delivery of product quality.
➤ Chools was engaged with the firm to deliver a technology platform for better management of their supply chain. Their then-current supply chain management practices were rigorously analyzed. Before developing a full-fledged solution, Chools diagnosed major key issues.
➤ Each geographical region had a different measurement system which made the evaluation of the global operations difficult. Reactive management tactics were being used due to the lack of transparent data on the company’s operations. Low standardization and information were shared between plants, which resulted in duplication of the activities. Labor-intensive manual data collection and analysis were identified time-consuming and took focus away from value generation activities. Data access was complex with different storage systems.
The Approach
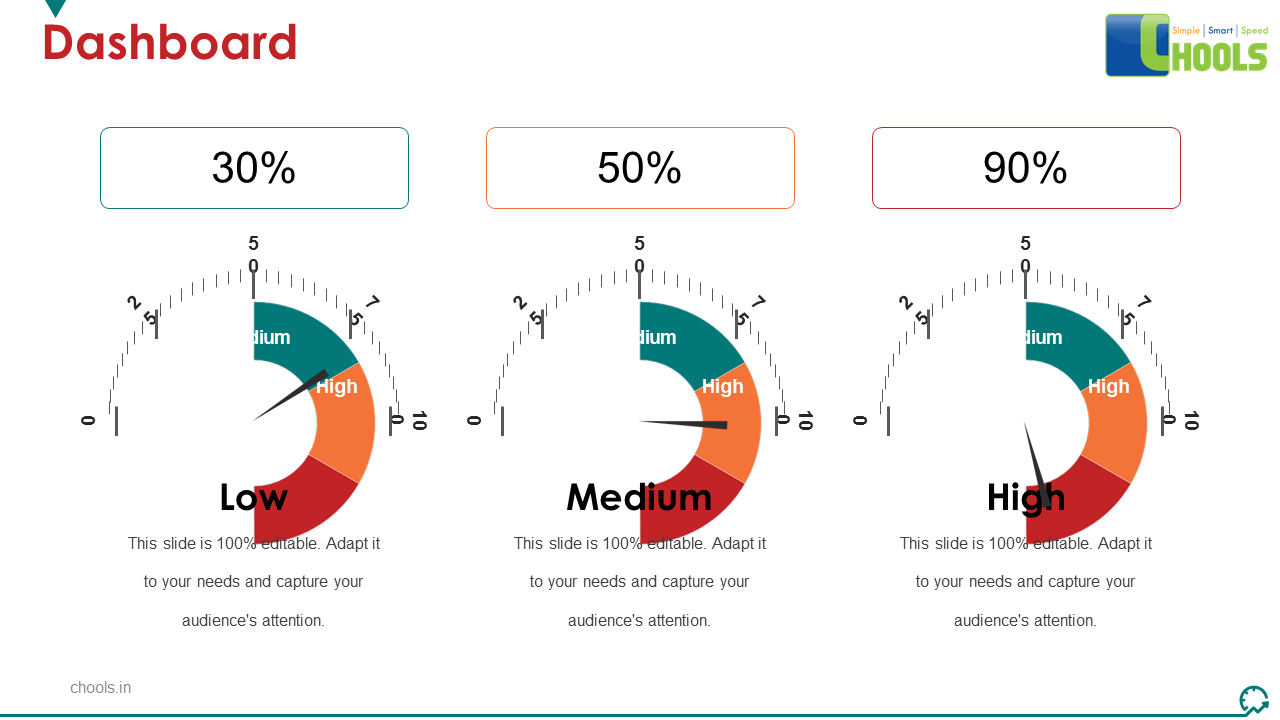
➤ Chools initiated candid discussions and interviews with relevant stakeholders to understand their strategic objectives. We assured their current pain points are addressed in the solution. Based on inputs, Chools developed a fully customized supply chain management dashboard. It delivered vital aspects of the client’s supply chain. We interacted with top management and veteran industry analysts and decided on three prime areas to focus on for improvement. Standards compliance, customer satisfaction and employee engagement. To capture the performance on these key issues, and based on detailed discussion with metric stakeholders, we developed a set of Key Performance Indicators (KPIs).
➤ To create awareness among the stakeholders the significance of each metric, Chools systematically developed the training materials. The tool was initially piloted on a small scale and then was implemented all across the supply chain division.
➤ In the backend scenario, the workflow was streamlined with careful planning and process automation. The client’s data streams were programmed to be seamlessly integrated into the cloud from multiple sources including ERP systems.
The Results
➤ The supply chain management dashboard designed by Chools enabled the stakeholders to make informed decisions. Management could easily track the current performance against the target objectives, and take necessary actions to ensure operations in line. Top management could diagnose the problems swiftly from the global level to the plant level. The dashboard turned out to be an indispensable tool in driving critical business decisions. It contributed to the reduction of violations of labor and operational standards.
➤ The comprehensive report generated offered a granular view of the operations and helped to identify the best and the worst-performing plants. Management used this information to transfer the best practices of the performing plants to the ones poorly performing.
➤ The automation freed the time spent on routine data collection. The centralized information repository eliminated the time spent on creating ad-hoc reports. It generated a better flow of information throughout the organization. Enhanced data visibility eliminated the blind spots hindering the supply chain. With Chools, the client achieved alignment with their strategic objectives in multiple-levels.
1. OPERATION PERFORMANCE METRICS
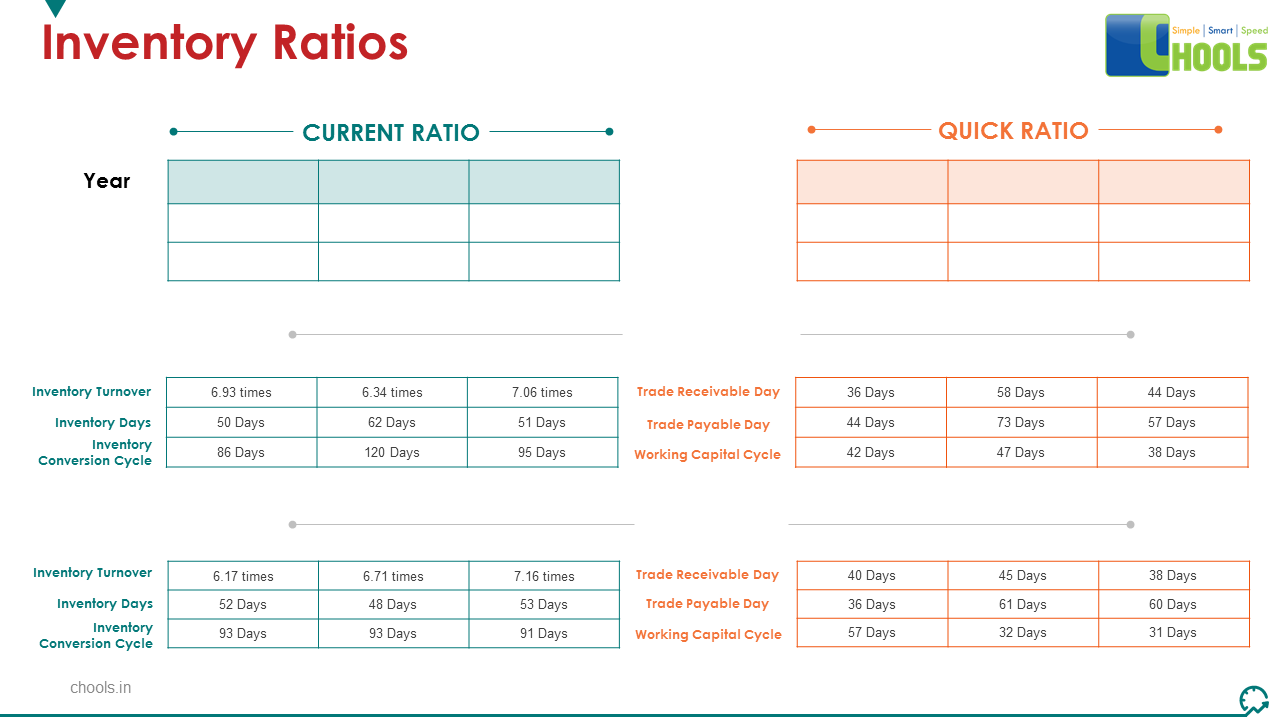
2. SUPPLY CHAIN INVENTORY MANAGEMENT
3. SUPPLY CHAIN KPIs
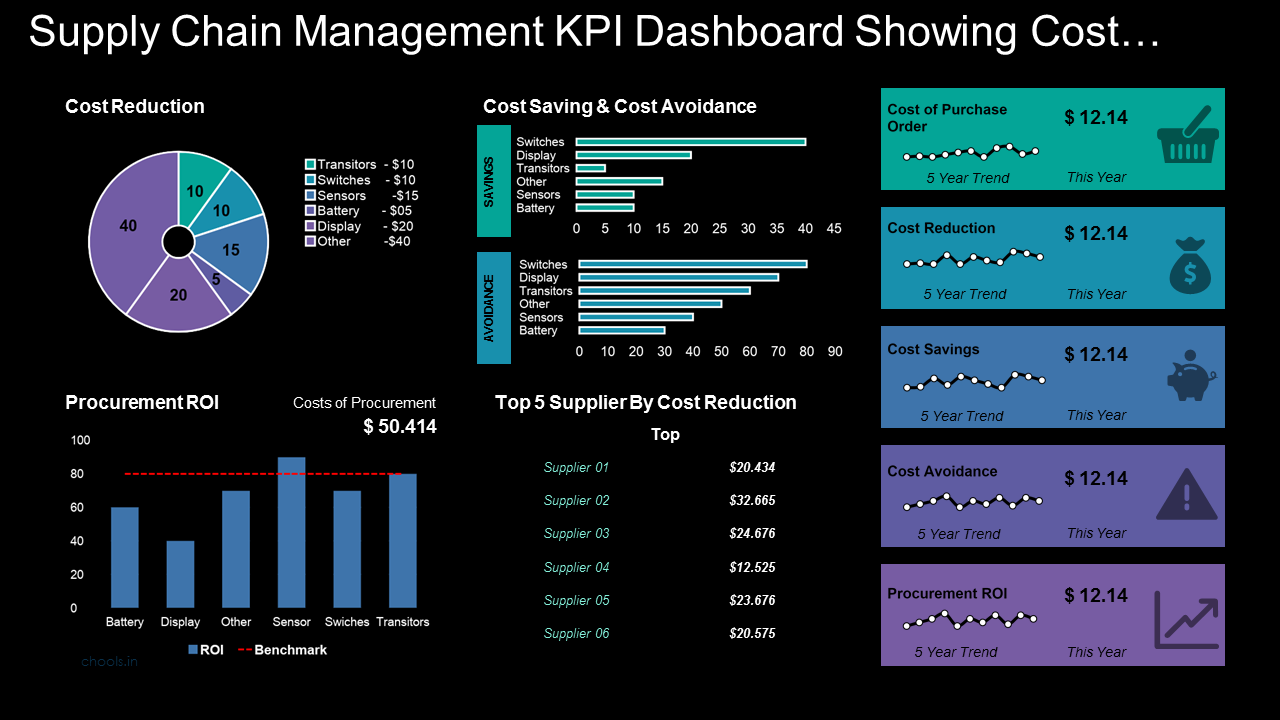
4. SUPPLY CHAIN KPI DASHBOARD
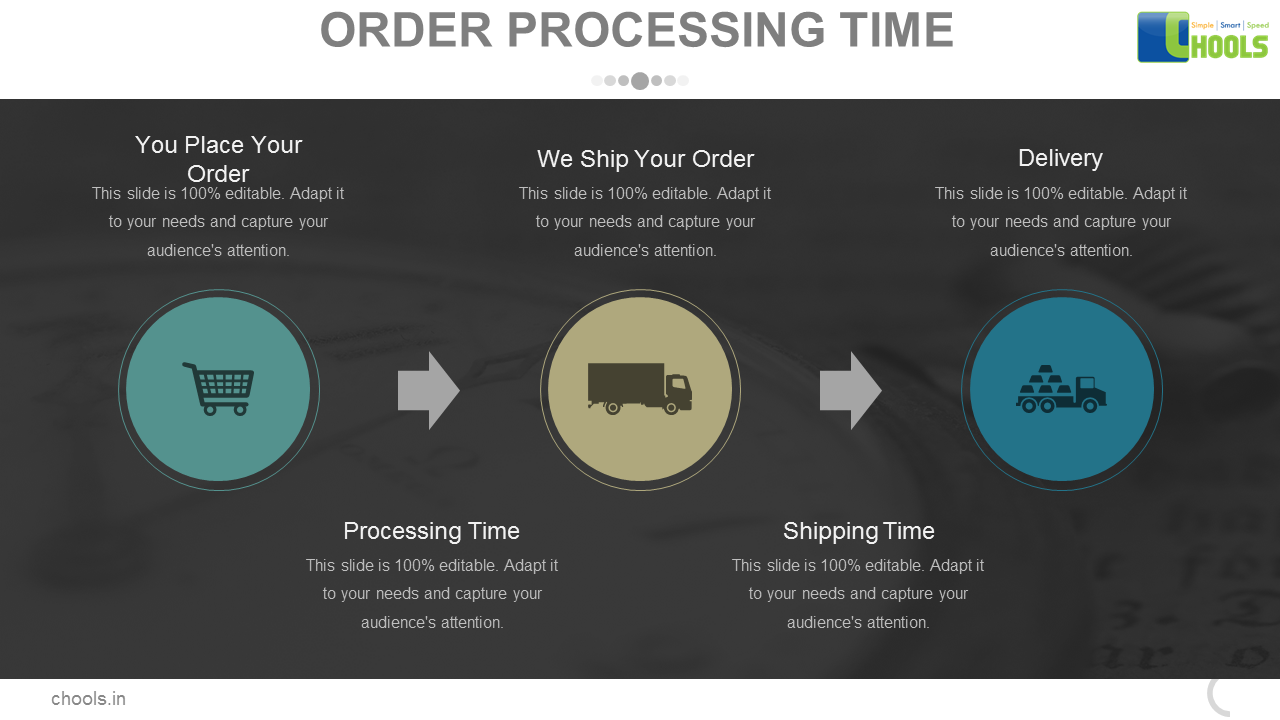
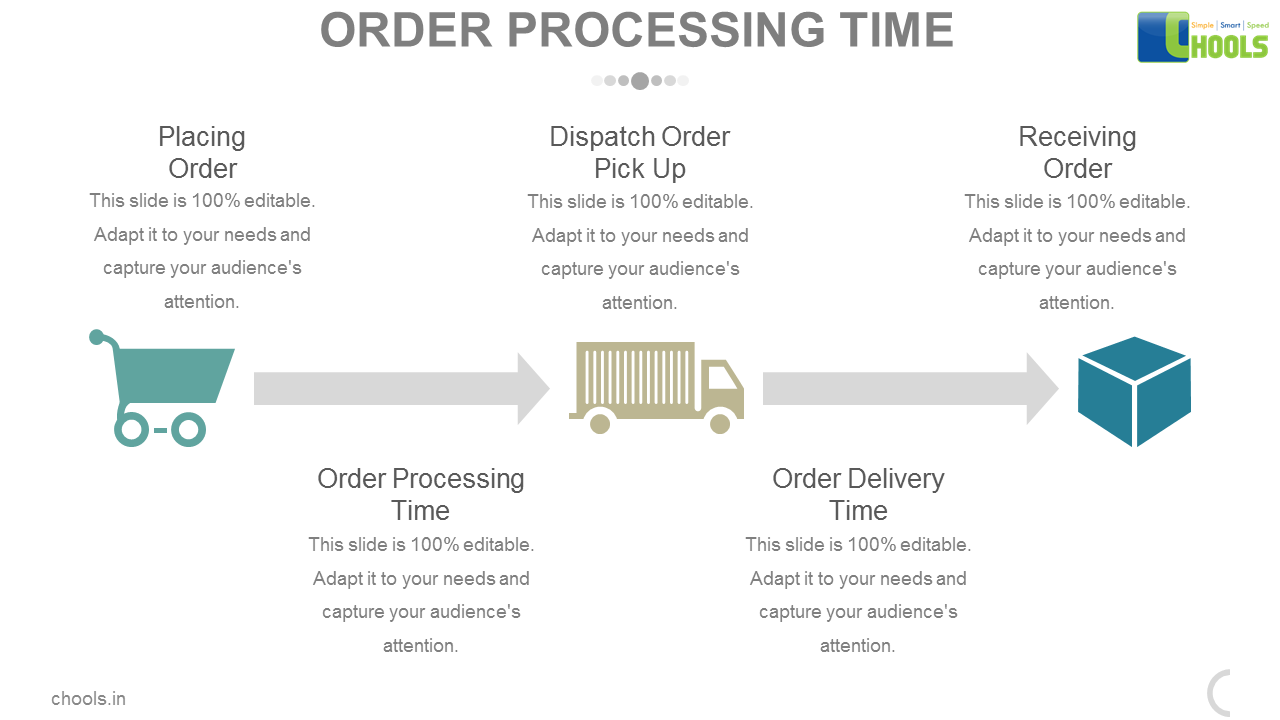
5. SUPPLY CHAIN MANAGEMENT ORDER PROCESSING
6. SUPPLY CHAIN MANAGEMENT PERFORMANCE
7. SUPPLY CHAIN METRICS &BENCHMARKING
8. SUPPLY CHAIN METRICS

