
Driving Profitability- Loss Tree Analysis
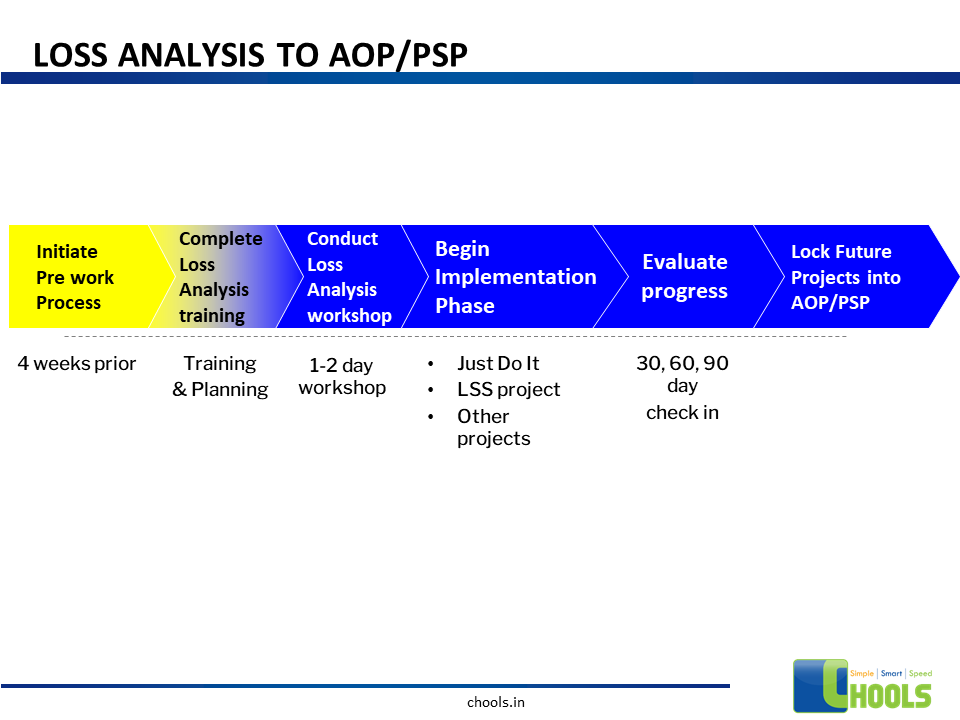
Loss tree is one of the effective continuous improvement tools used to drive productivity through Overall Equipment Efficiency losses elimination. Preliminary steps of measuring and analyzing will be followed with improvement plans and strategies.
Chools Competent team of Scholars and consultants will guide your teams through the process CADD – Collect –Analyze- Develop-Deploy to capture the gains.

Predicted Gains
➤ 5-7% productivity savings out of Manufacturing Base spend.
➤ > 90% Line Capacity Utilization
➤ Standard Work & Continuous Process Flow.
➤ Equipped, Engaged and Empowered Work force.
➤ Automation Solutions and Interfaces.
Our Methodology

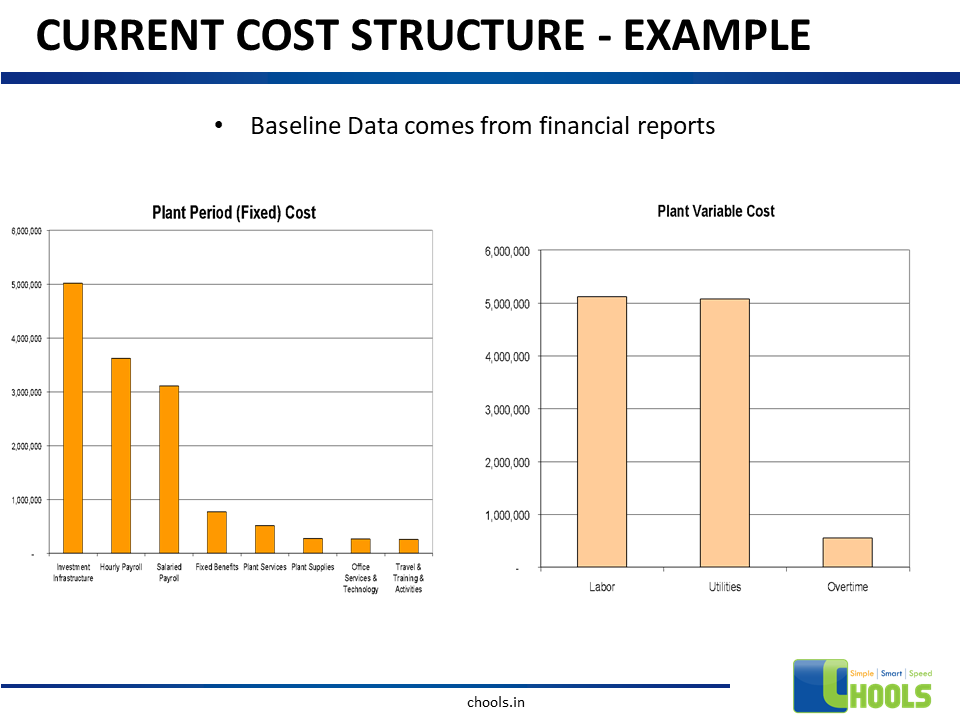
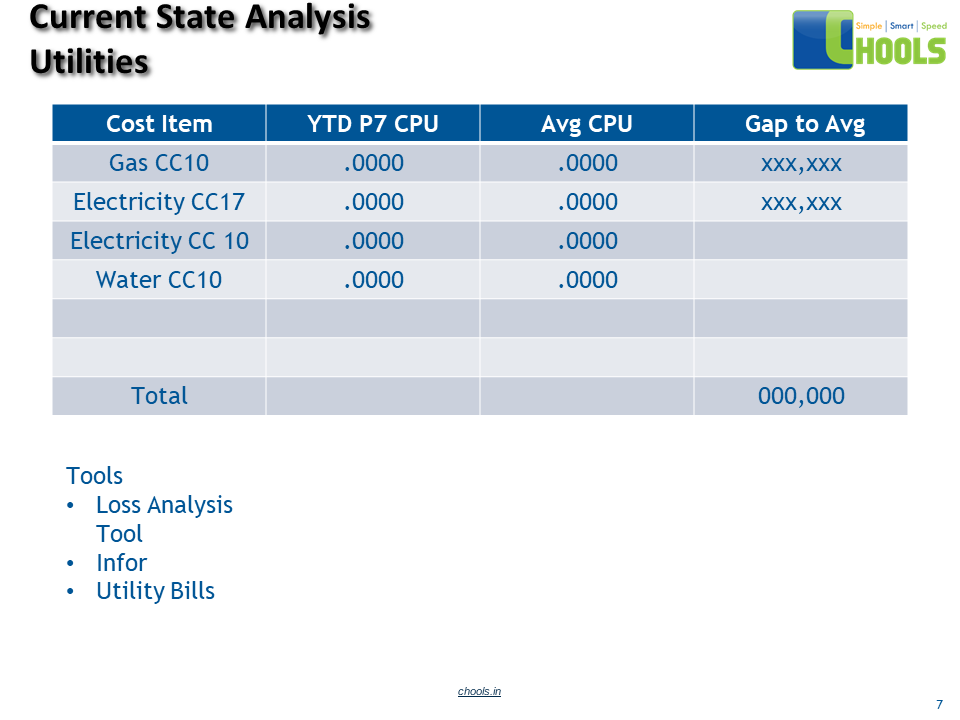
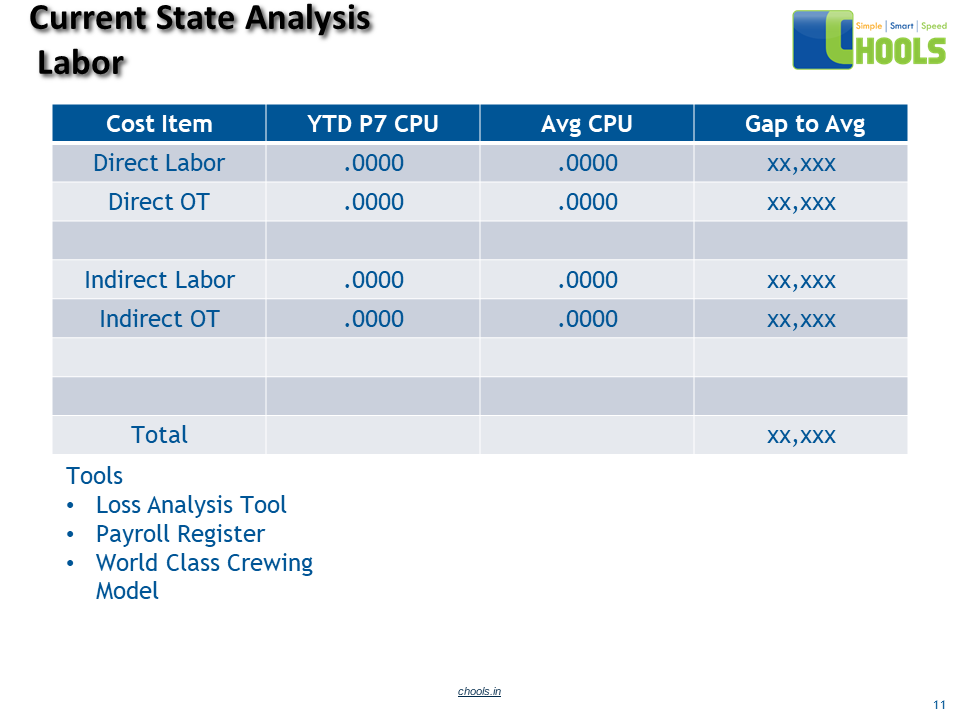
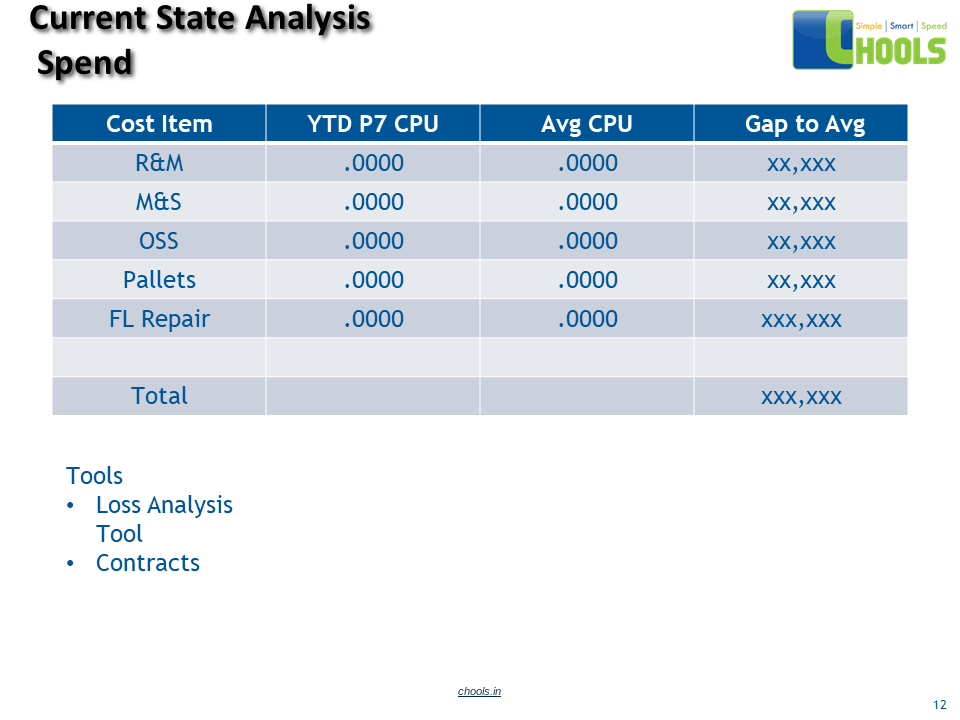
✔ P&L- Manufacturing overheads DATA – Direct /Indirect Labor, Maintenance, Utilities, Operating Supplies, .
✔ Process Key Performance Measures -OEE, Line Capacity -Non utilized time, Availability losses, performance losses, Quality losses, Equipment downtime.
✔ Gemba walks | Line As -Is Audits | Employee Diagnostics – Cultural assessments

✔ Tree Loss Tool
✔ Brainstorming , Nominal Group Technique
✔ Problem solving Techniques: FMEA, 8D, 5 whys,BDA, FISHBONE
✔ Gap Analysis- Current OEE VS Glide path
✔ Effort /Impact Matrix , SWOT

✔ OEE Glide path
✔ Standard Work Strategies
✔ Continuous process Flow strategies
✔ Total Productive Management Plan and pillar teams
✔ Vertical Startups -VSU
✔ SMED/QCO

✔ Create Balanced Scorecards for tracking
✔ Workforce Training
✔ Visual Controls , Andon , Poka-Yoke, Jidoka
✔ Kanban
✔ MES/ERP — Data Capturing
Related Case Study

Case : Chools was hired by 100 fortune Food and beverage company in North America-North East Region to drive and develop its Productivity, Lean Six sigma, performance and TPM journey. Loss Tree Analysis was one of the methodologies used to drive OEE Improvement.

Act : Chools Consultants conducted Loss tree analysis across 7 plants -23 production lines. Our consultants inside our CADD Methodology leveraged several Lean problem solving tools , Total productive Management, line studies – SMED, V Curves and above all trained the team.

Results : An annual Increase of 11% OEE points was realized for the NE region, this translated to $7.3MM .Savings captured encompassed all MOH ; Labor utilities , Maintenance and operating supplies costs.
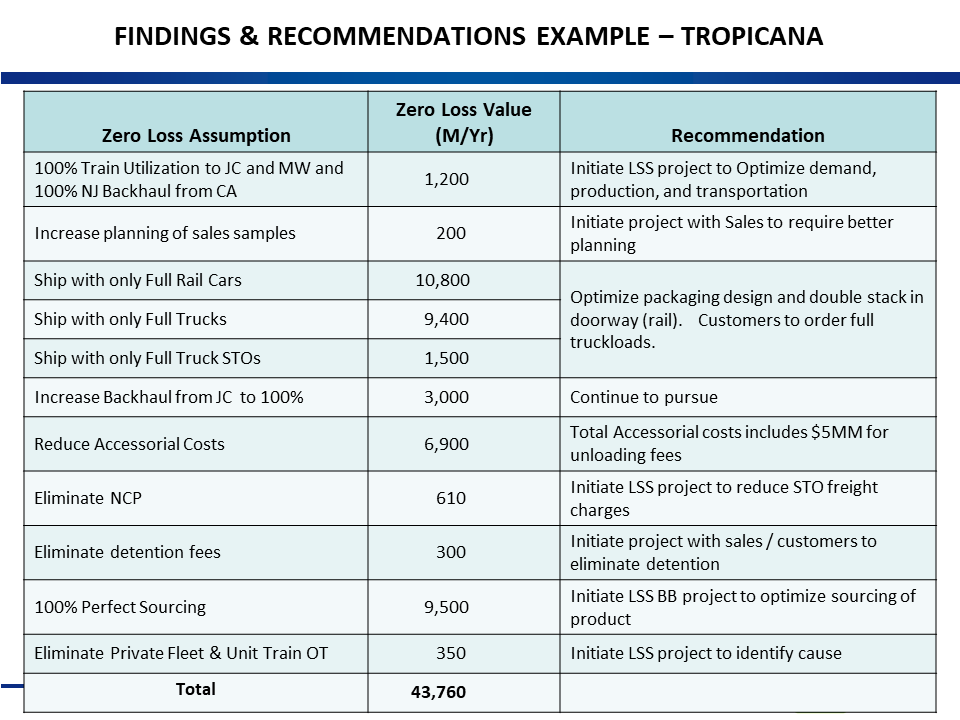
Driving Profitability- Loss Tree Analysis - Case Study
Case
A Leading Juice producer hired Chools to improve the overall equipment efficiency for their production lines. Chools consultant started with the going through the Loss analysis tree to identify biggest losses. One of the biggest opportunities was identified as a Cleaning in Place (CIP) activity on their Highest volume PET Line. The CIP took 5 hours vs. a standard of 2 hours benchmarking with other affiliates This had an impact of 6% Loss on OEE. The OEE was 75%, short from the annual operating plan by 6%.
Solution
After looking at the historical Data, we conducted a Pitstop event to measure all tasks and analyze with the line crew the opportunities and improvement plan for the CIP activity, which consists of 5 steps (Cold CIP, Hot CIP, Chemical Sanitization, Cold CIP, External Cleaning). The following was identified
✔ Optimize scheduling to reduce number of CIP through improving forecast accuracy measure.
✔ Optimize sanitization Matrix.
✔ Modify Piping diameters to increase flow and decrease time.
✔ Optimize temperature of Hot water cleaning step to reduce waiting time for getting filler Hot, which also influenced Fuel and water consumption.
✔ Reduce time of steps validated by Quality team.
✔ Eliminate first Cold step cleaning.
✔ Conduct external cleaning in parallel to last CIP step through installing water nozzles on filler.
Results
The CIP Time was reduced from 5hrs to 2hrs, and number of CIP events were reduced from 156 to 78 times per year. The Loss on OEE contributed by CIP for this Juice line was reduced from 6% to 2%. The $/case for that line and SKU was reduced by 17%. In addition, Water consumption was improved by 11% and Fuel consumption by 5%.
Case
A Liquid Hand Soap Manufacturer with an annual production of 255MM tones was aiming to increase its profitability and revenue through improving its overall equipment efficiency of their four production lines. The OEE for the plant was 71%, short from the annual operating plan by 4%. Chools consultant started with the going through the Loss analysis tree to identify biggest losses. Two of the lines were not meeting their OEE target and had the largest volumes and therefore Chools focused with the team on those two lines.
Solution
Chools chose to conduct a Focused improvement event ( A DT5 event- Check our other services ) on one of the lines, and start and Autonomous Maintenance program on the other line (Which showed a high downtime due to minor stops on the machines).
As part of the DT5 Focused Improvement event, our consultant used the 4 DT5 tools to identify opportunities and the below was found:
✔ 11 major equipment defects that reduced reliability of the machines were identified.
✔ Raw Material Variability that is reducing the 7.7oz Line efficiency by 15%.
✔ The top three Equipment OEE loss contributors were identified and a root cause analysis was conducted for problem solving.
✔ Accumulation table cannot support downstream equipment downtime on the 11oz size.
The above gaps were fixed and OEE improvement driven
Autonomous Maintenance
After establishing the AM team and training them, the team formed the required AM tools and standards to execute the program: CILT (Cleaning, Inspection, Lubrication, Tightening), Centerlines, One Point Lessons, safety maps and Job Hazard Analysis. The lines were scheduled every shift to execute the established standards and reduce downtime caused by machine reliability.
Results
The OEE of the plant increased by 10 % across the course of 1 year, driven by the improvement on both lines. The FI DT5 event drove a 6% improvement on the Line 1 and AM drove 7% improvement on Line 2. This resulted in a reduction in the $ Cost/case by 17% increasing plan profitability. In addition, plant labor productivity increased by 31%.