
Driving Profitability- Value Stream Mapping
➤ Are you striving to Grow, Thrive and Lead today’s competitive markets?
➤ Are you running dynamic Operations in either the Service or the Manufacturing Sectors?
➤ Are you working to drive Higher NOPBT year over year?
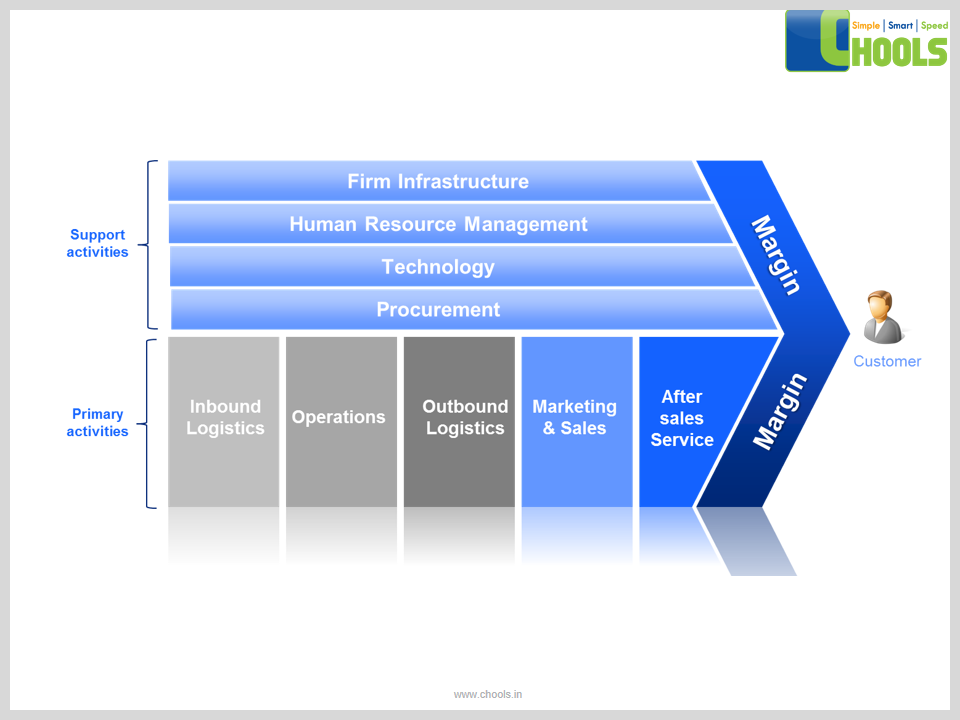
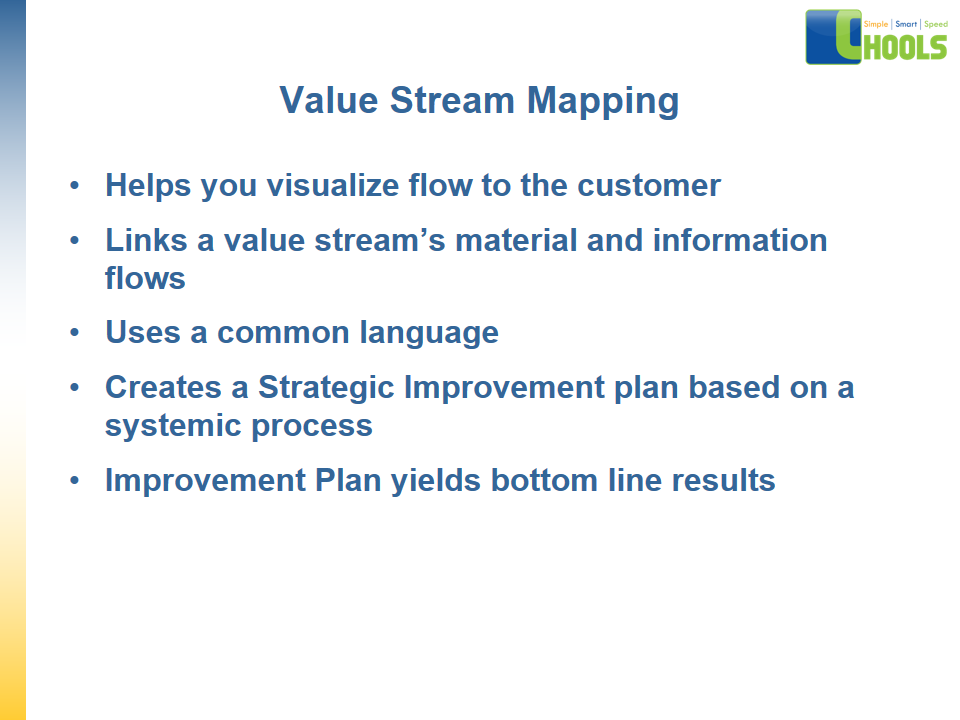
➤ Are you looking for a Lean Tool that would enable you to drive your Productivity Targets across the Value Chain?
➤ Are you eager to optimize your processes and Eliminate Non-Value Added processes; without compromising the VOC: the voice of the Customer and VOB: Voice of business?
➤ Are you searching for the Market leaders in Lean Six Sigma Consulting to lead your organization to World Class results?
➤ Our Competent team of Scholars and consultants partnered with several 500 Fortune companies to achieve their strategic and Annual productivity targets through executing value stream mapping consulting workshops; identifying and executing projects between $0.5Million and $10Million.

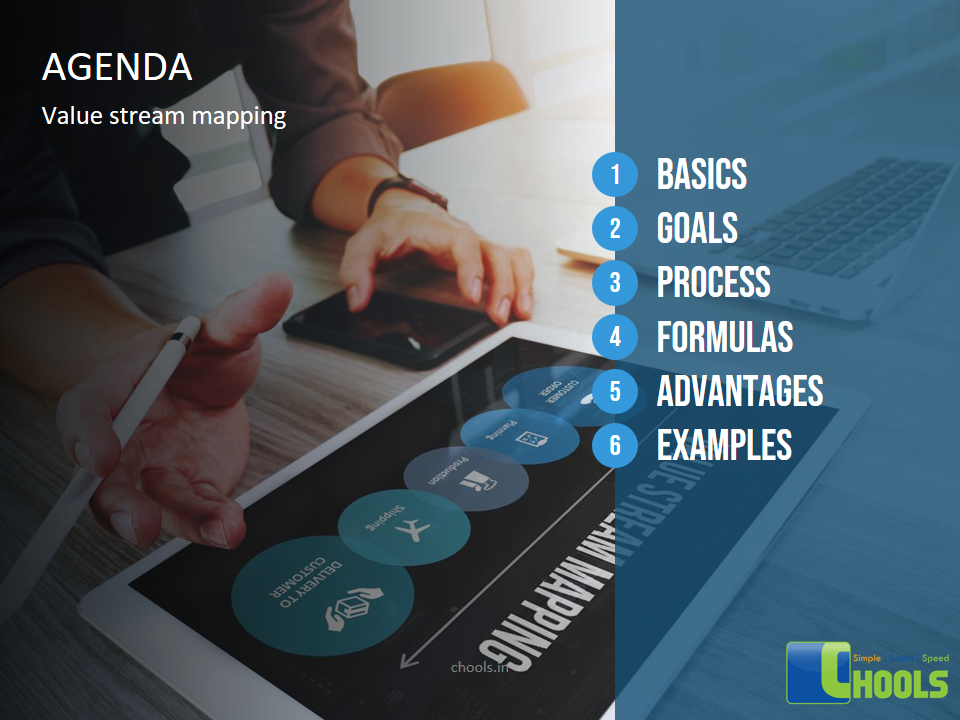
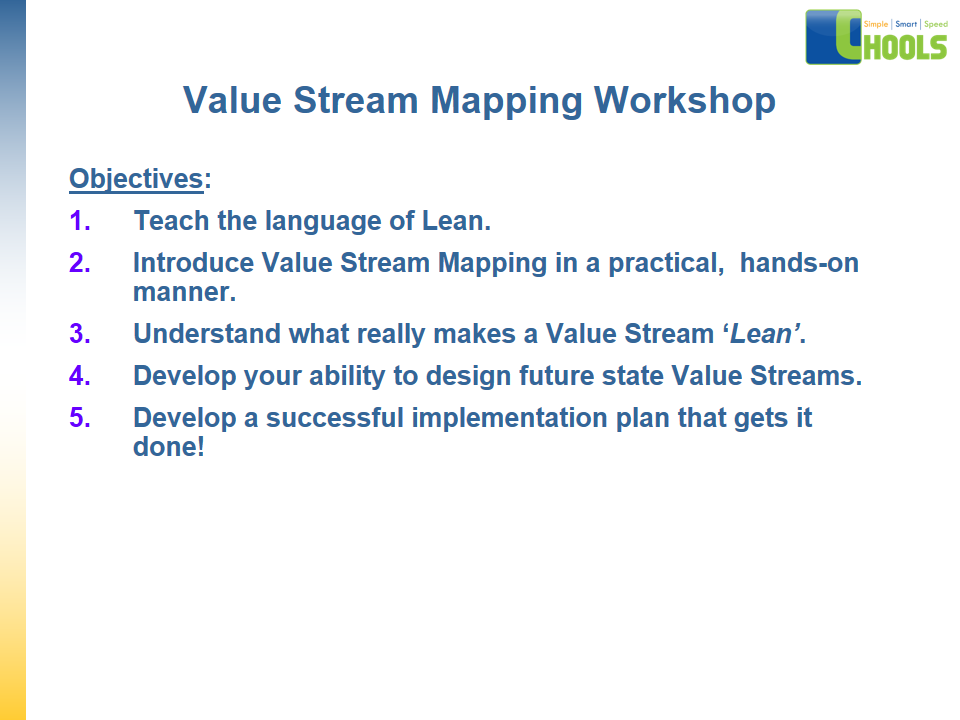
Objectives-WHAT
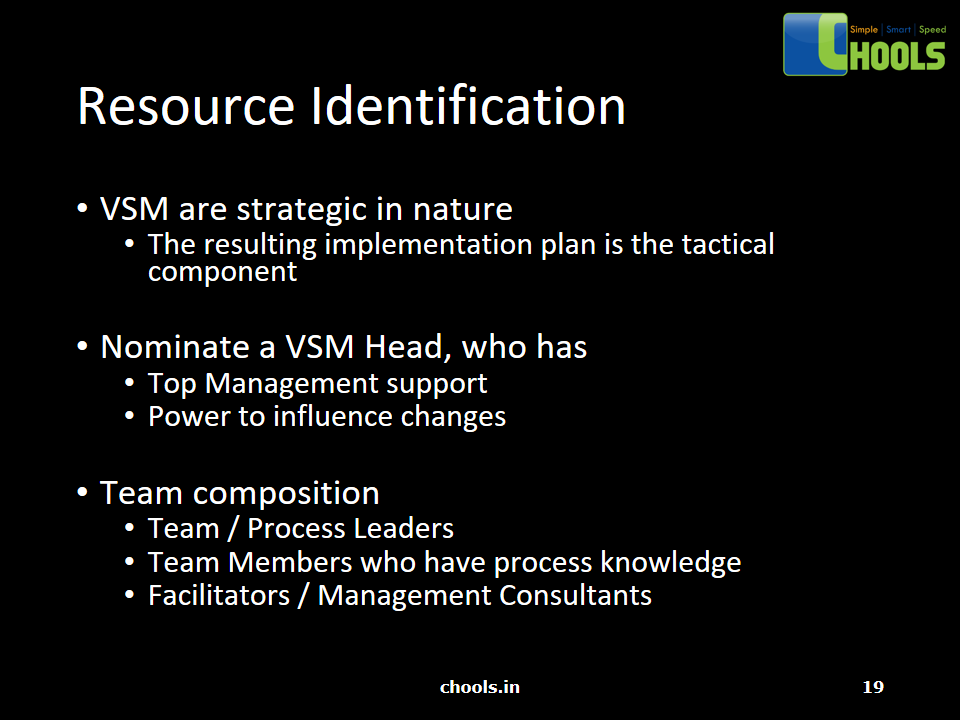
✔ Build the capability of your team in analyzing processes and identifying losses.
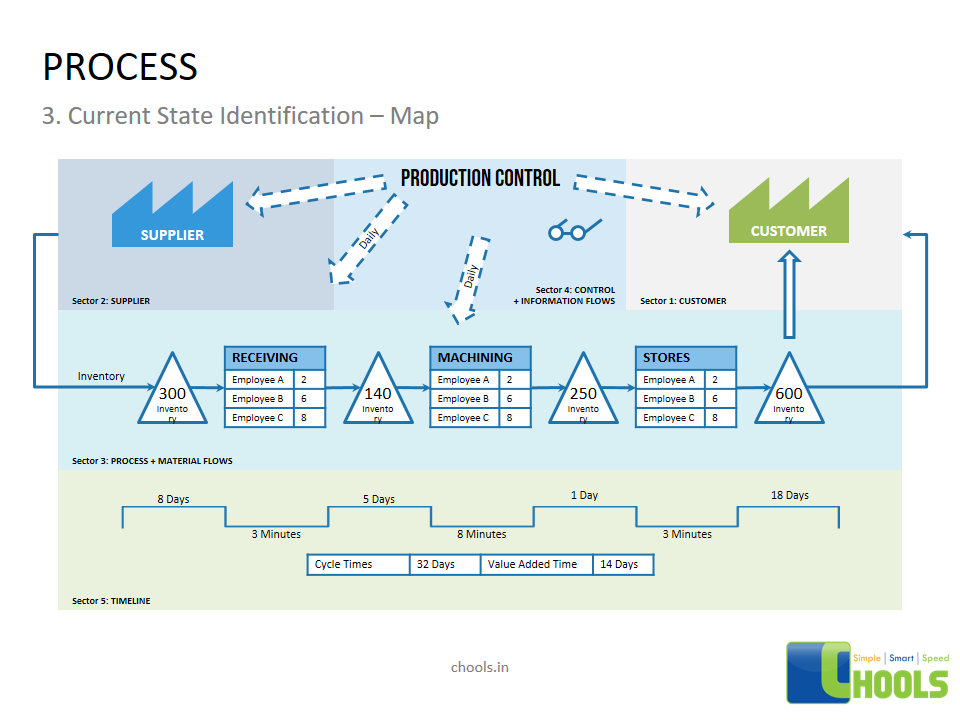
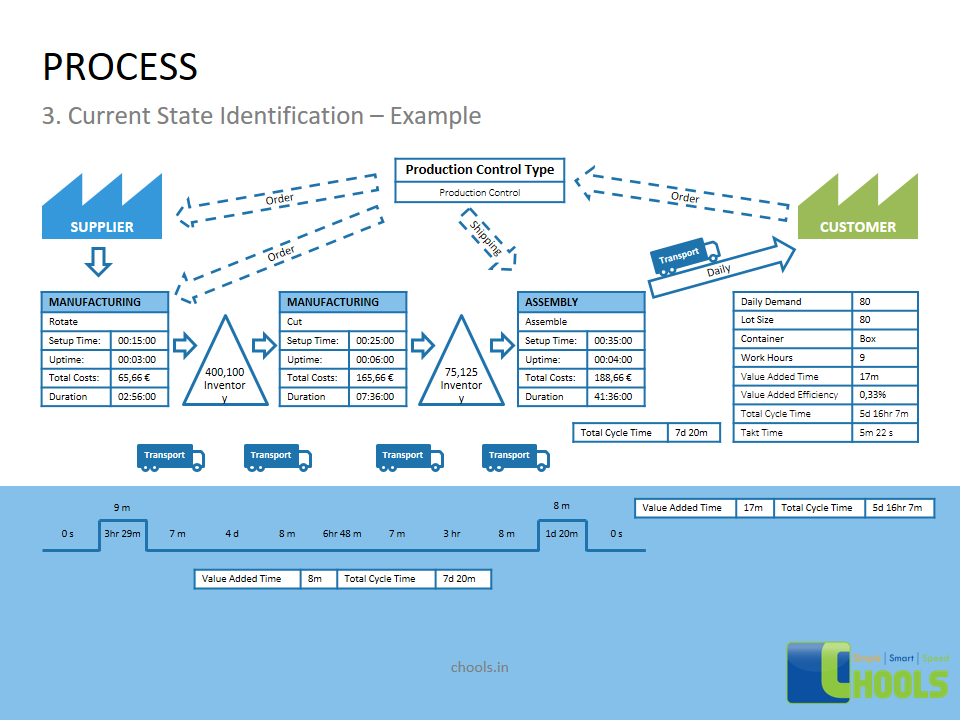
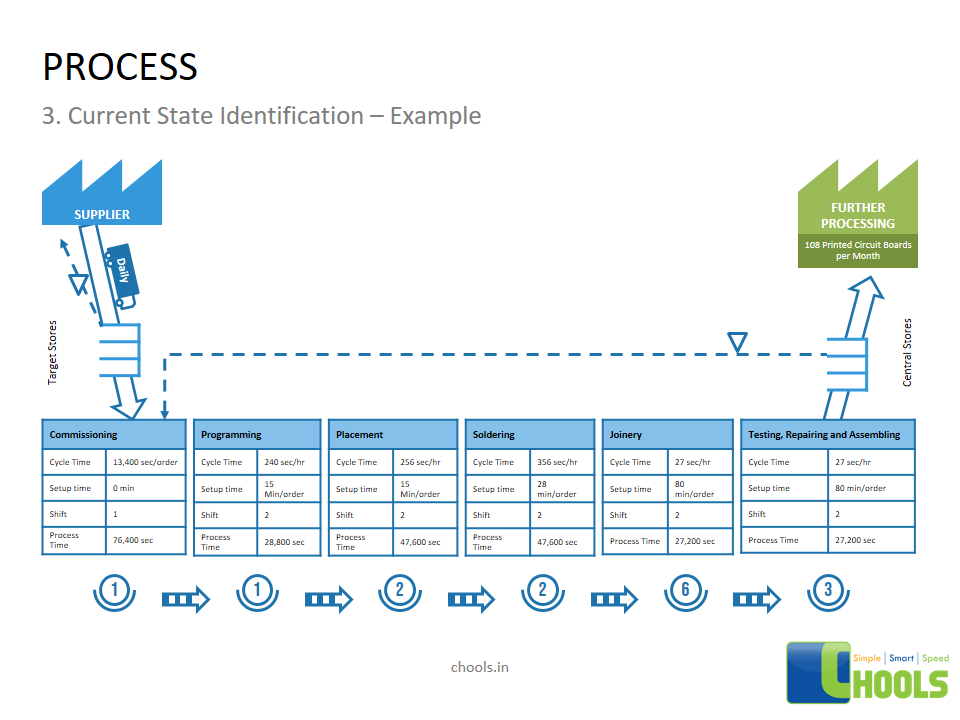
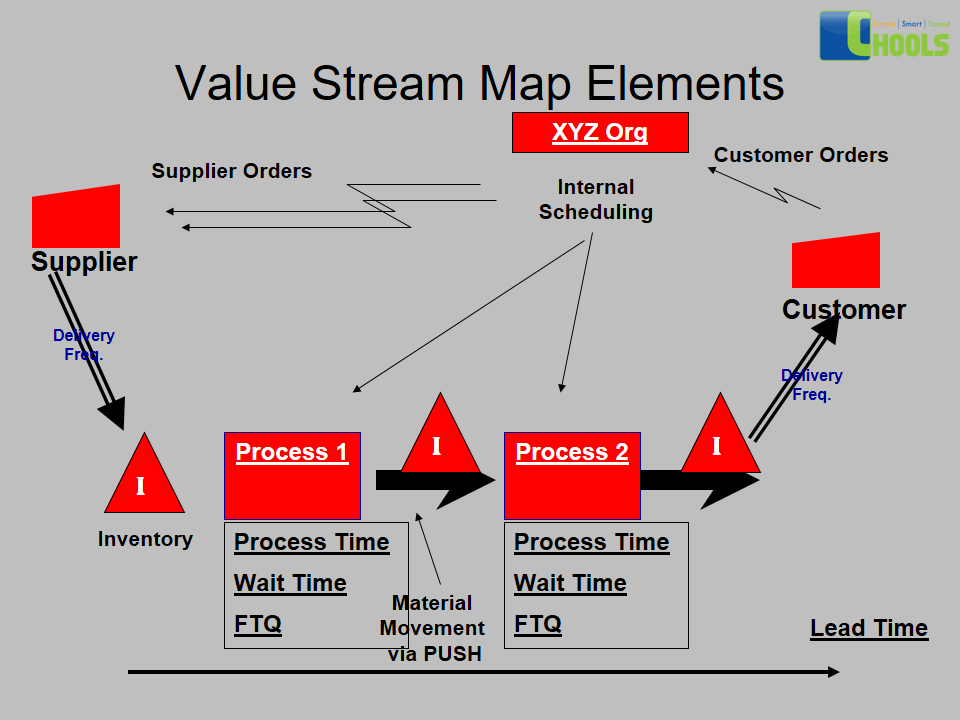
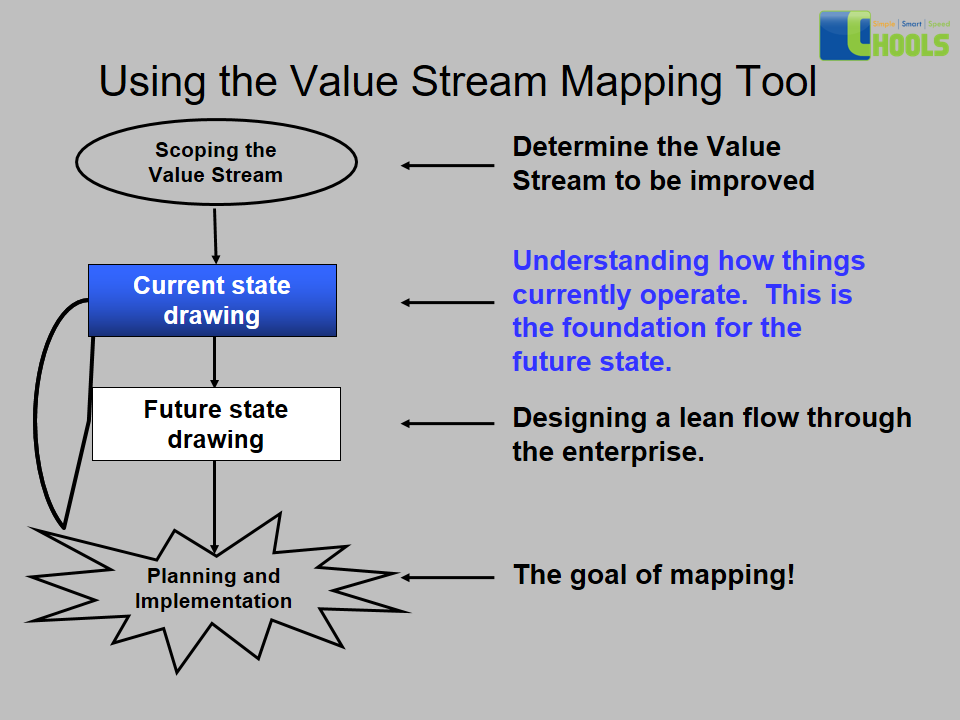
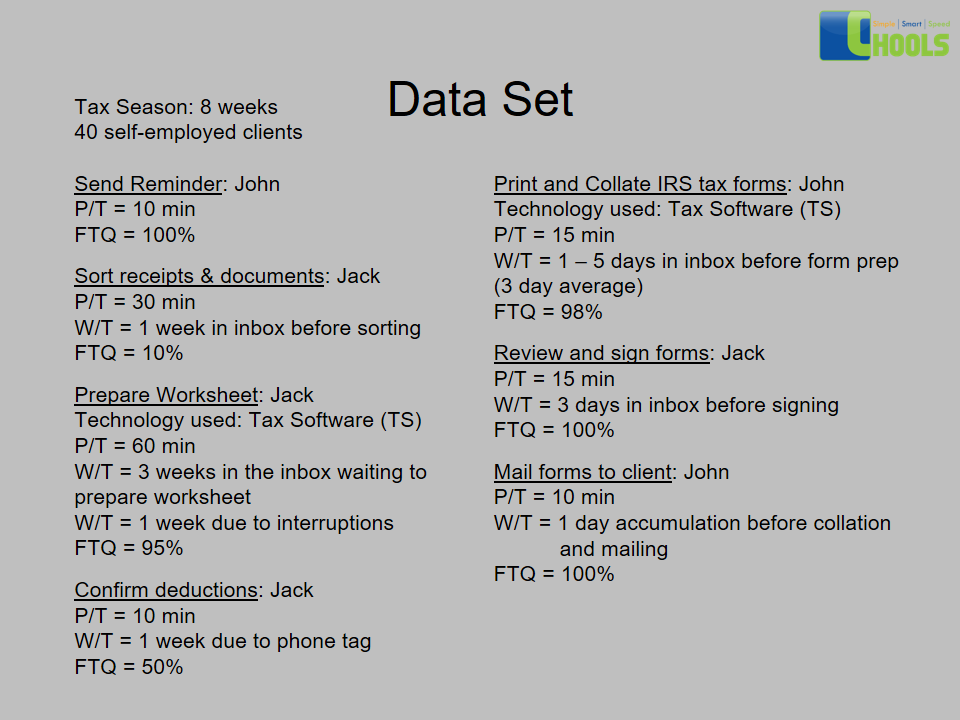
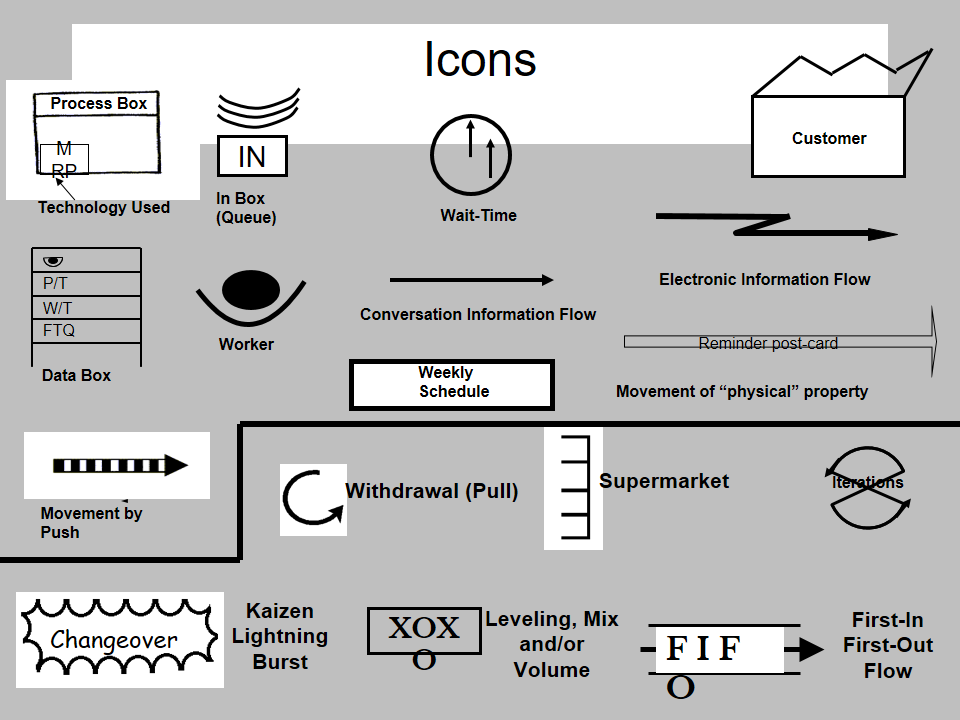
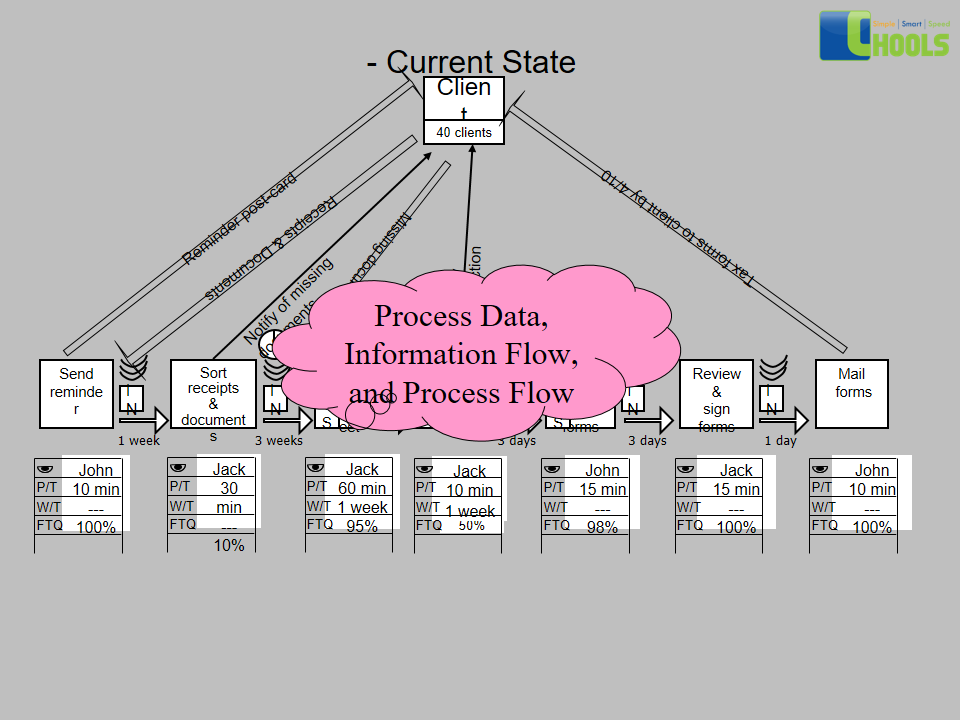
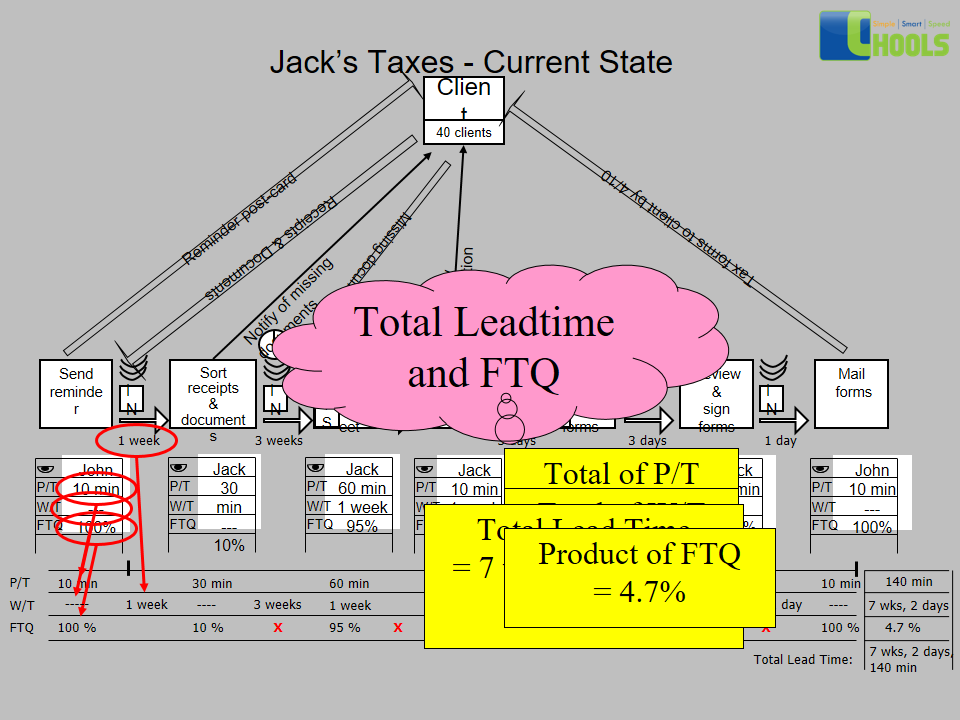
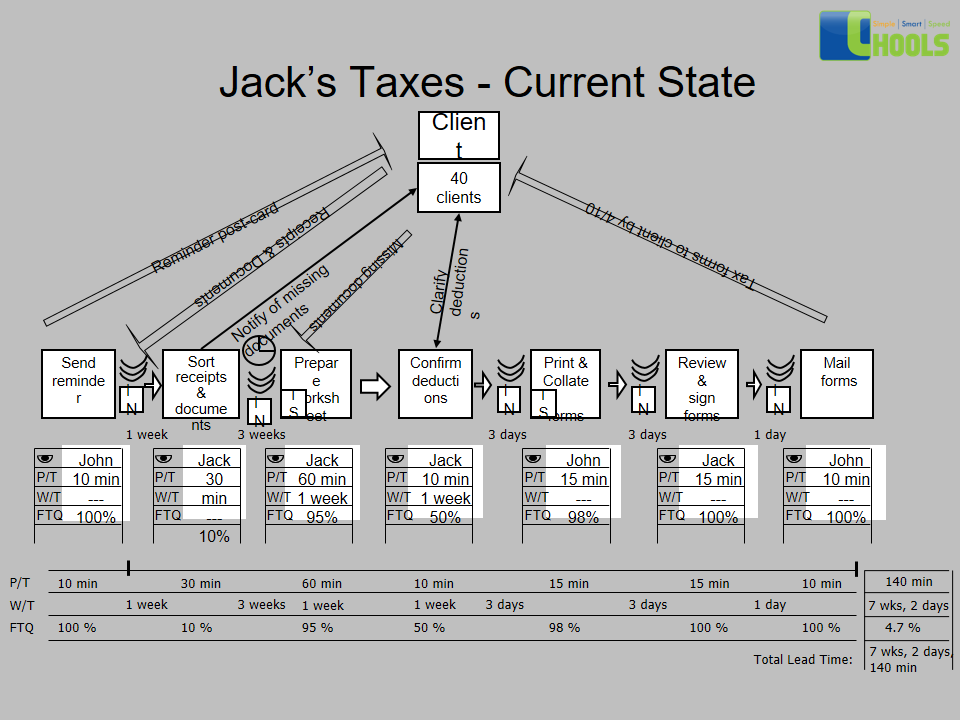
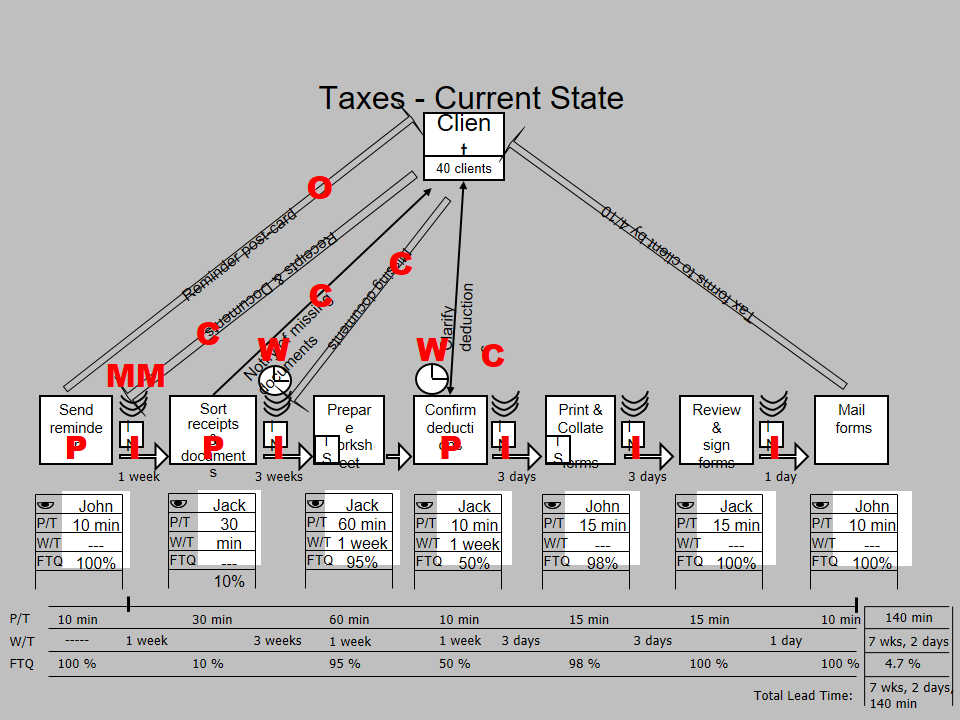
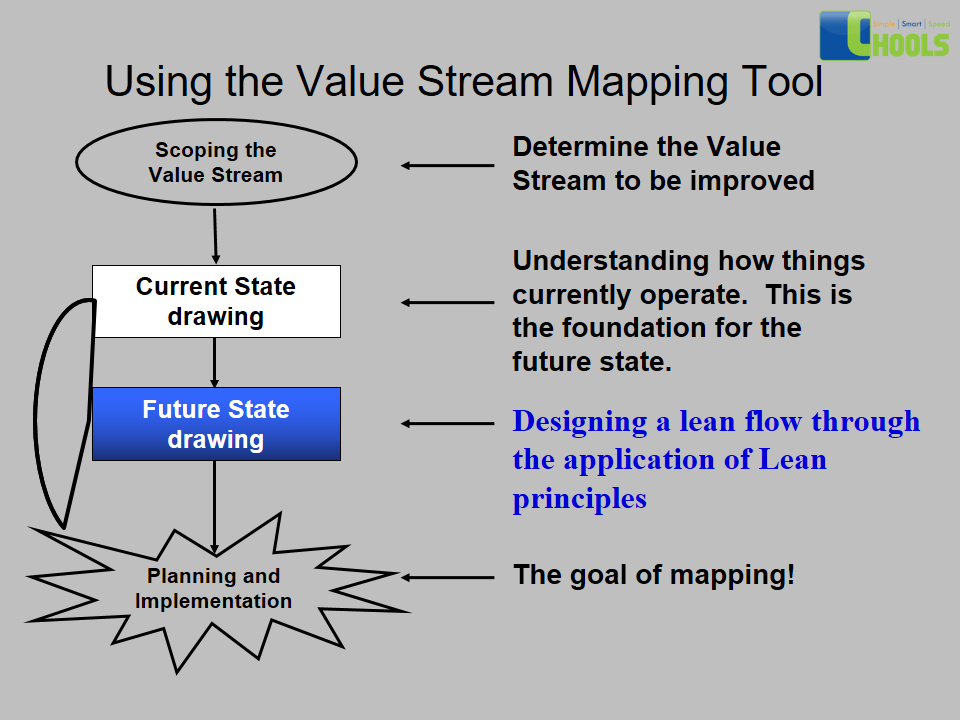
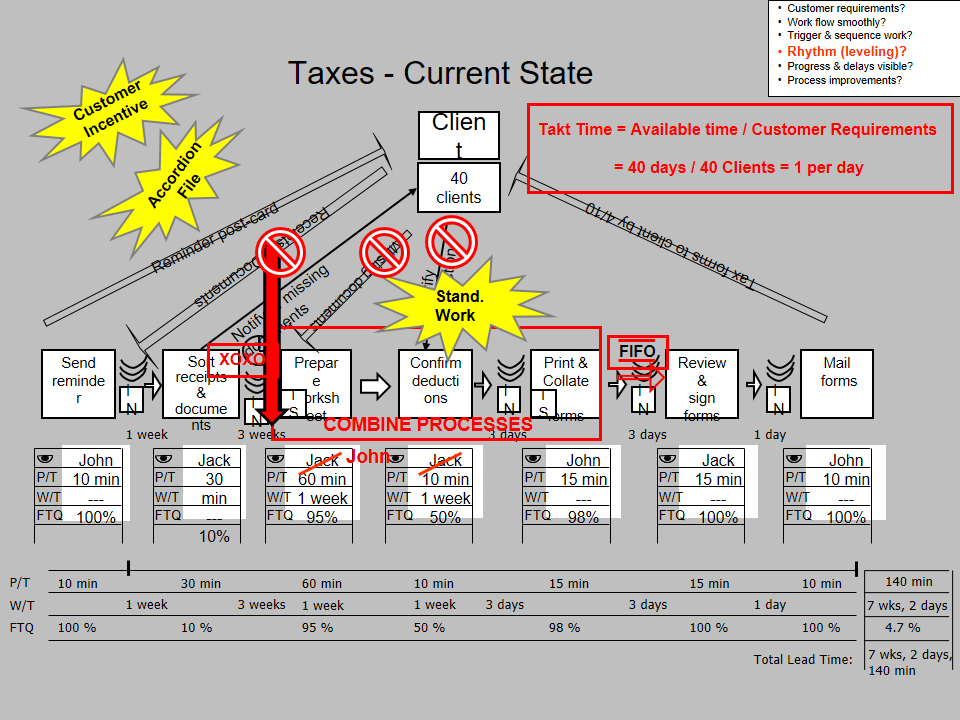
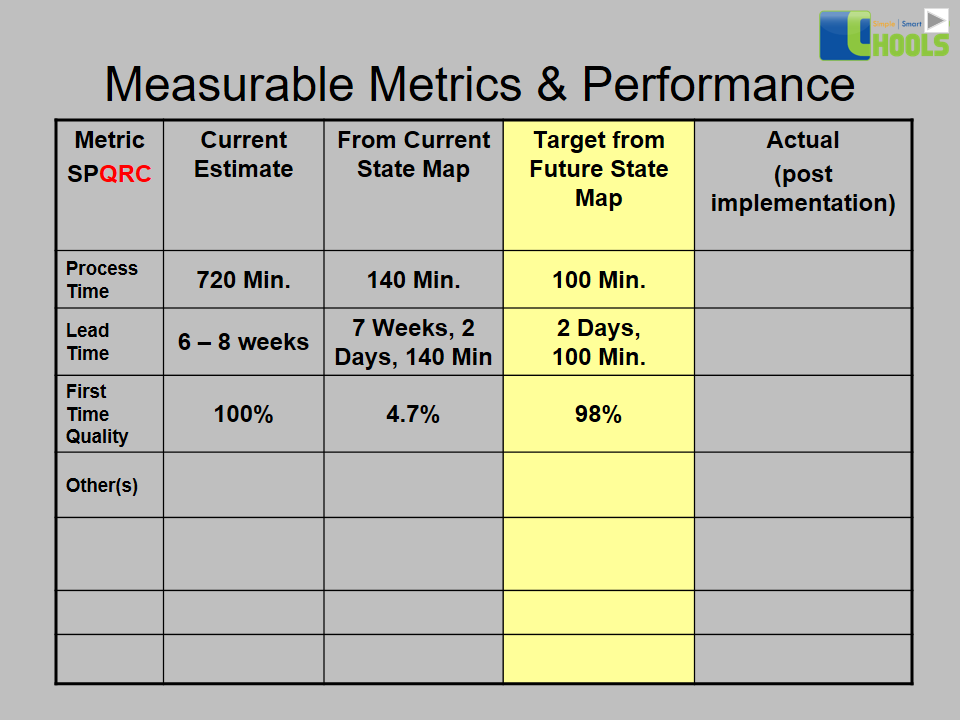
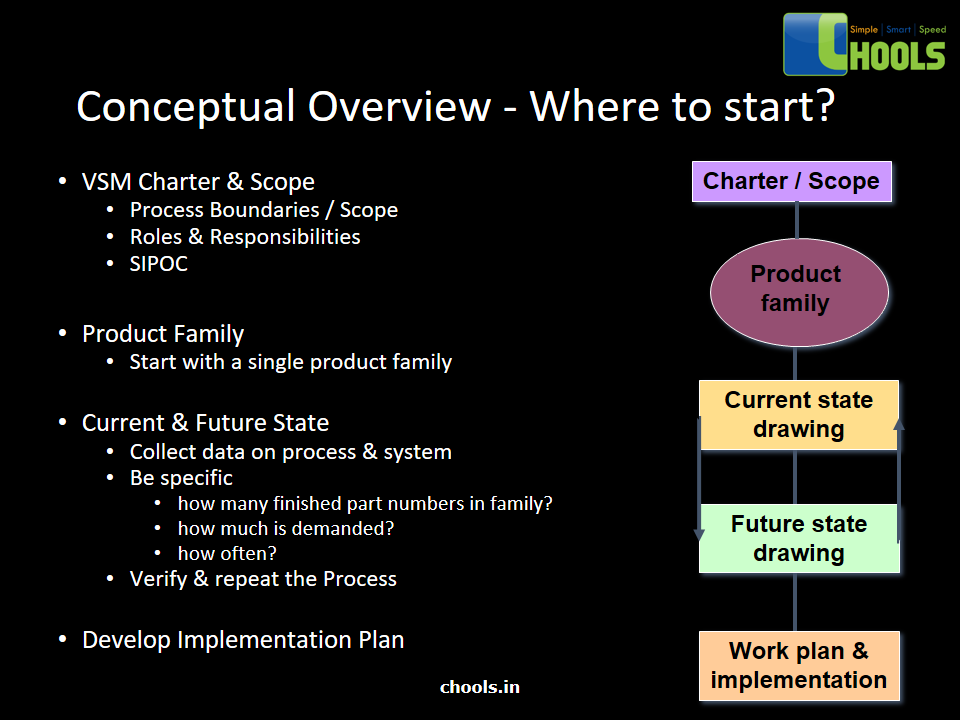
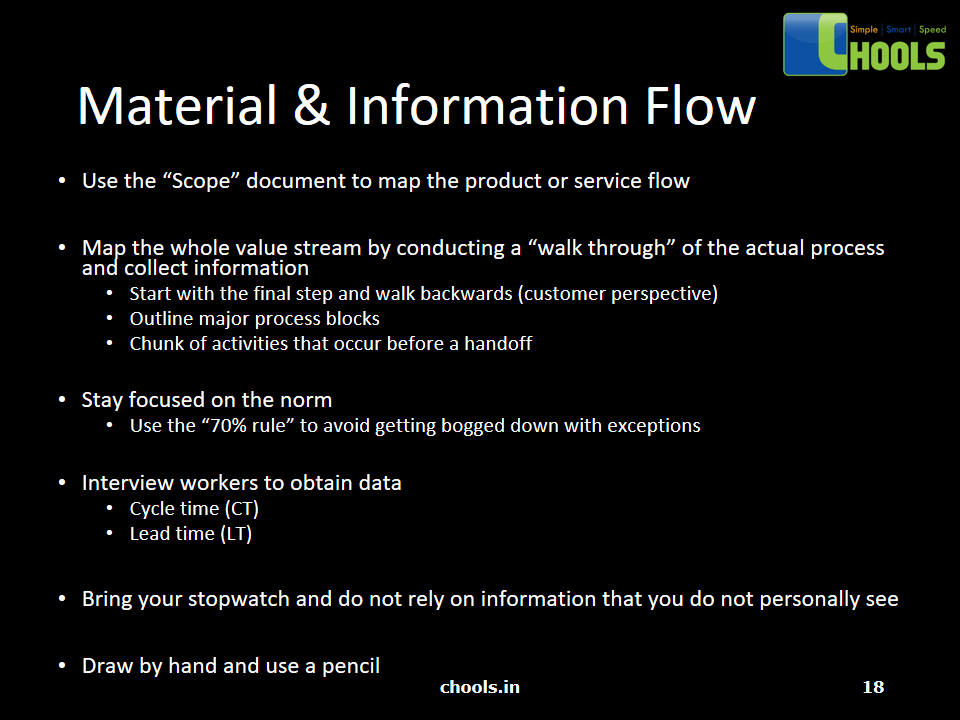
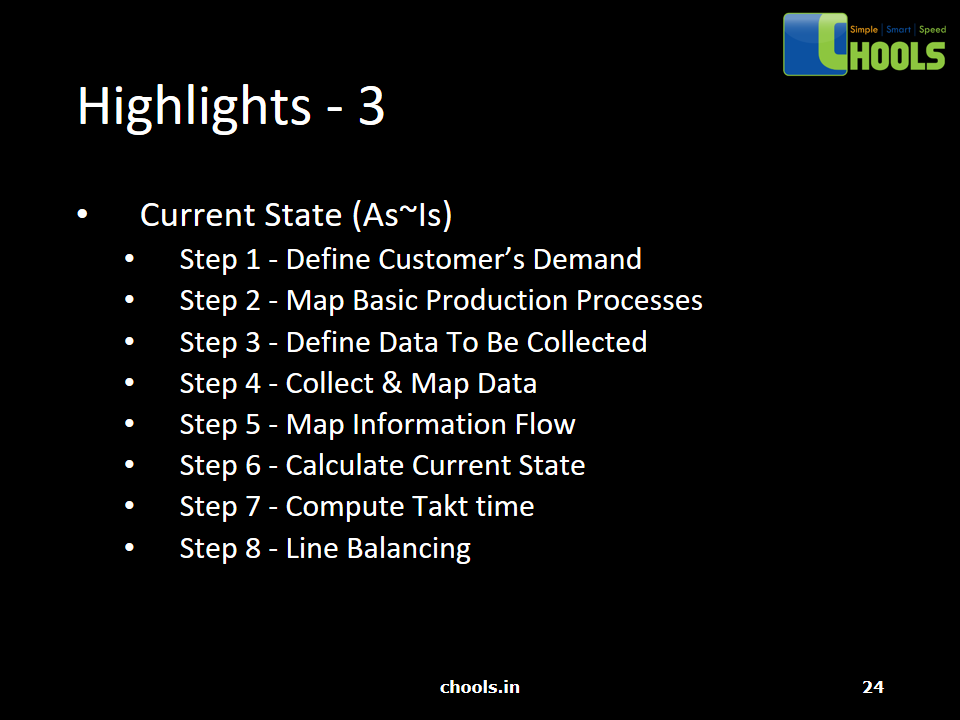
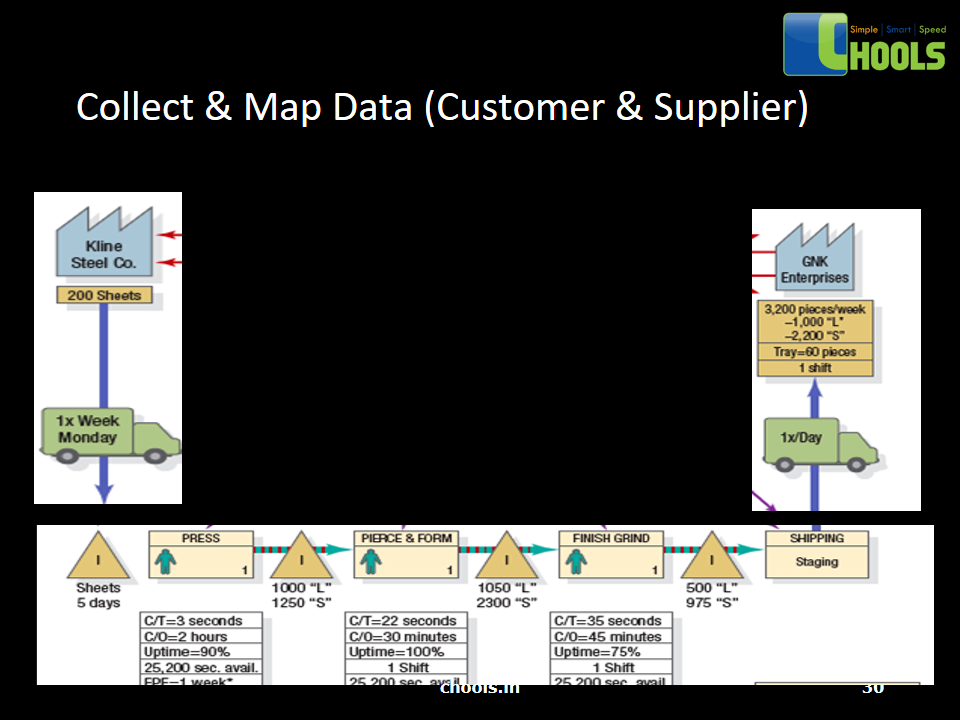
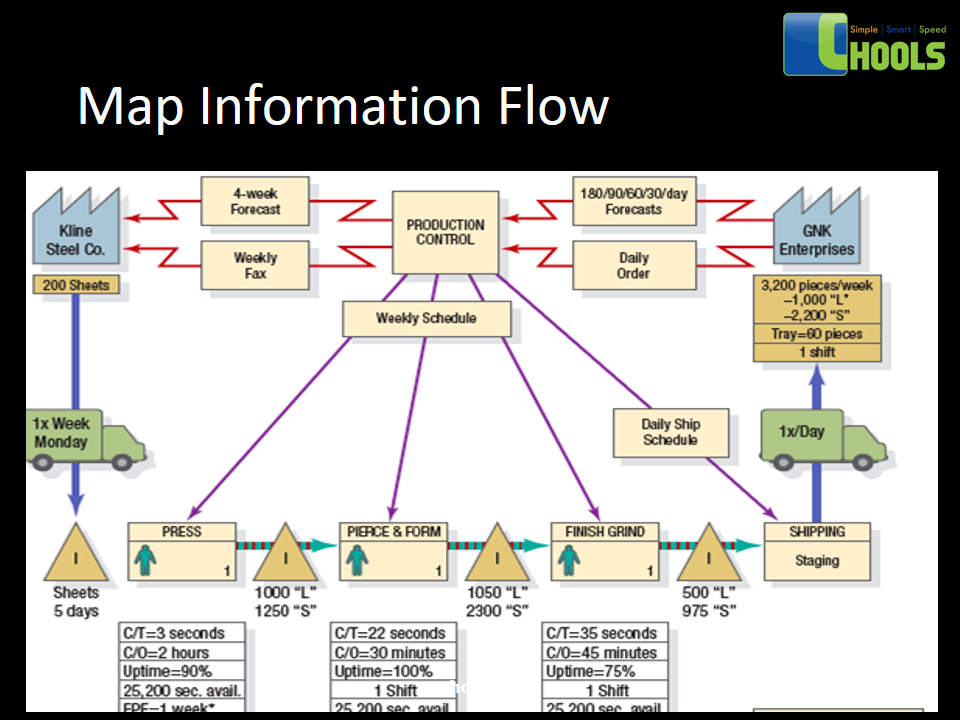
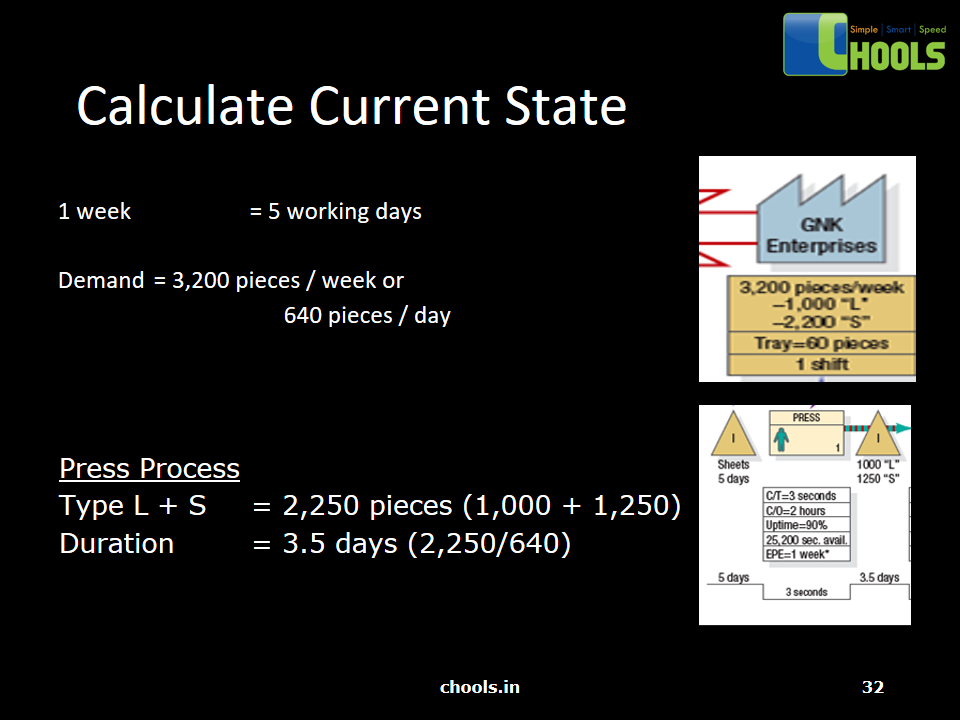
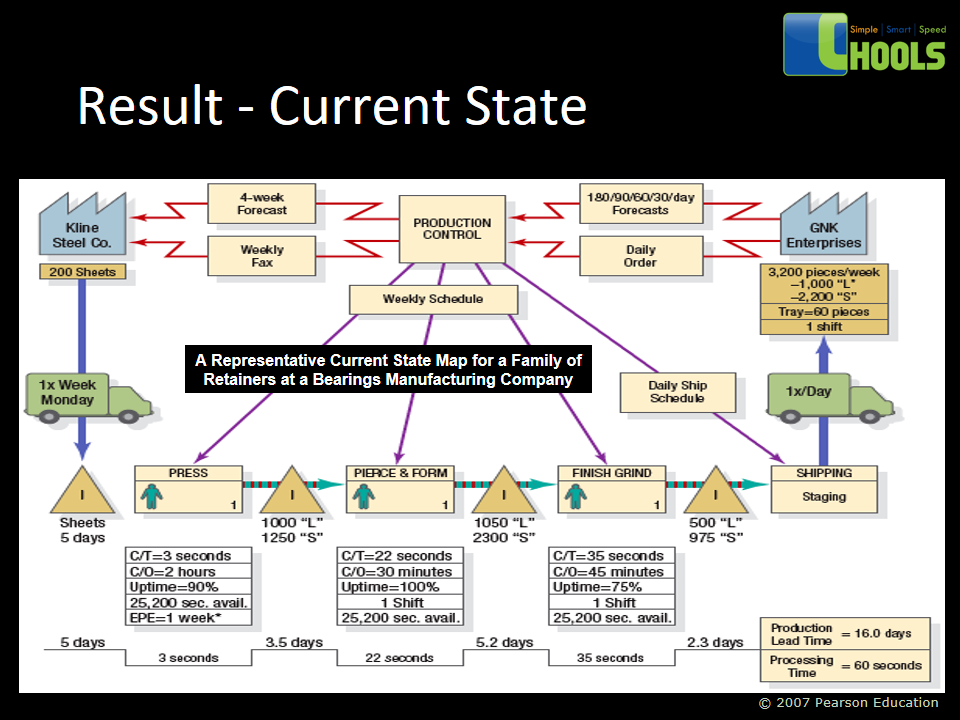
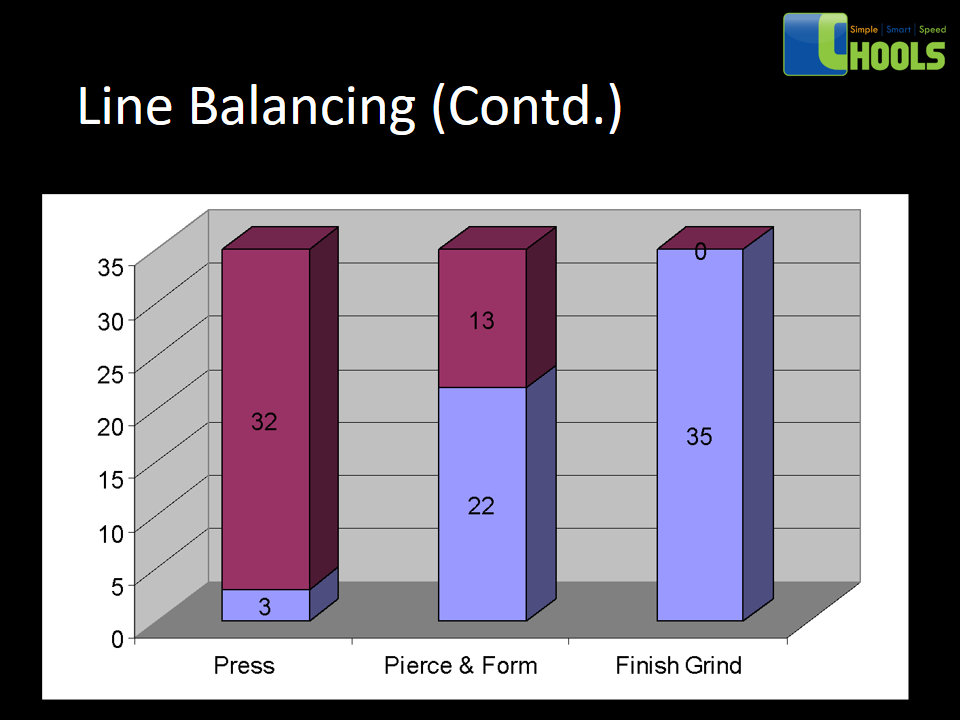
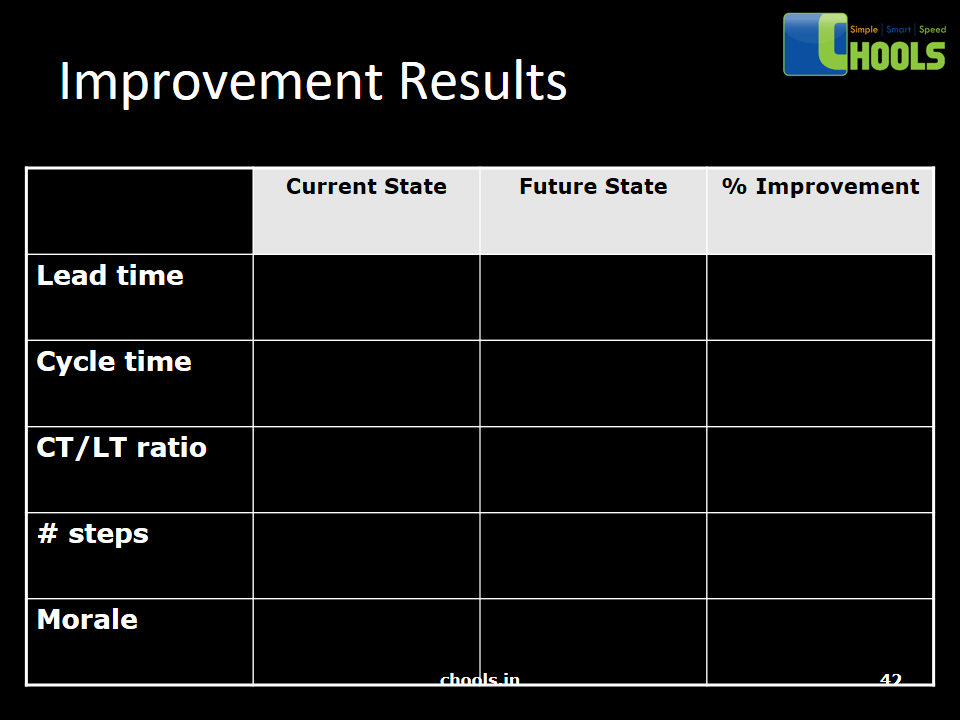
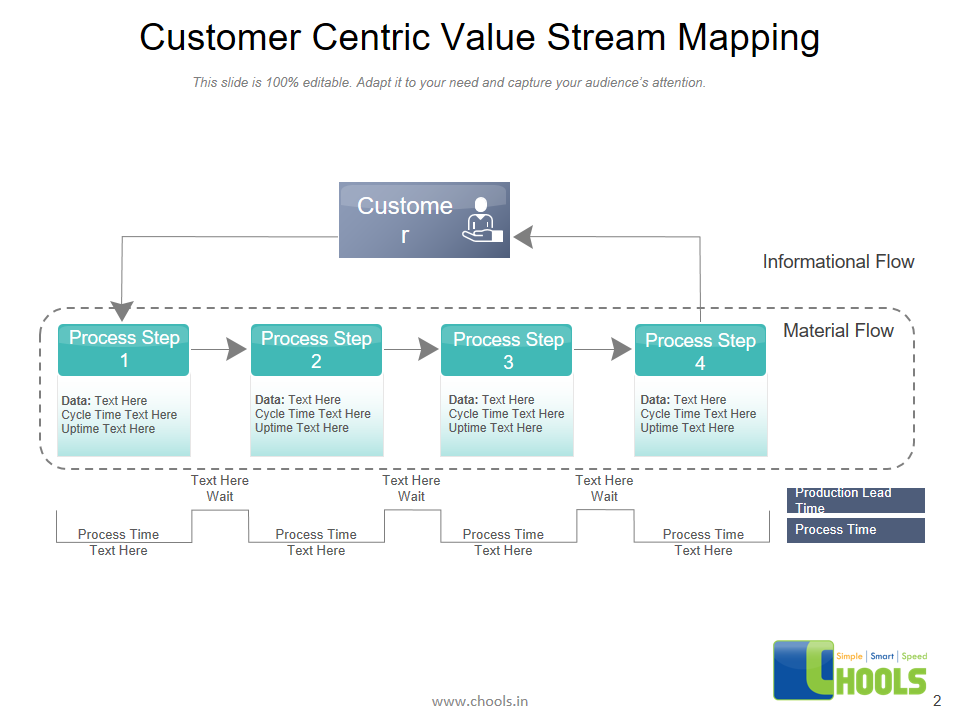
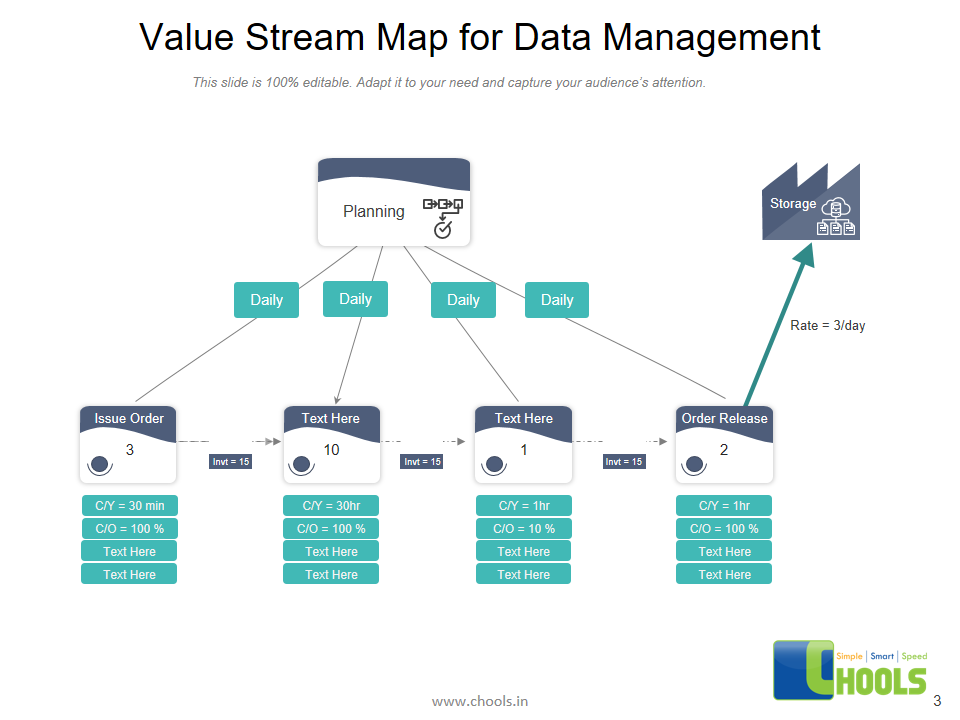
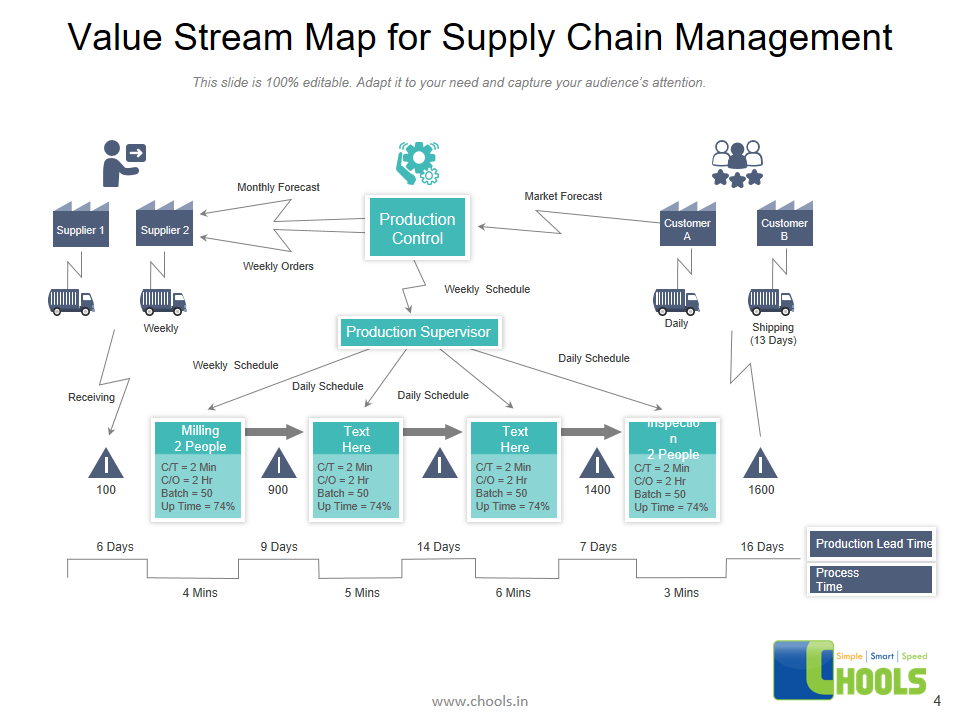
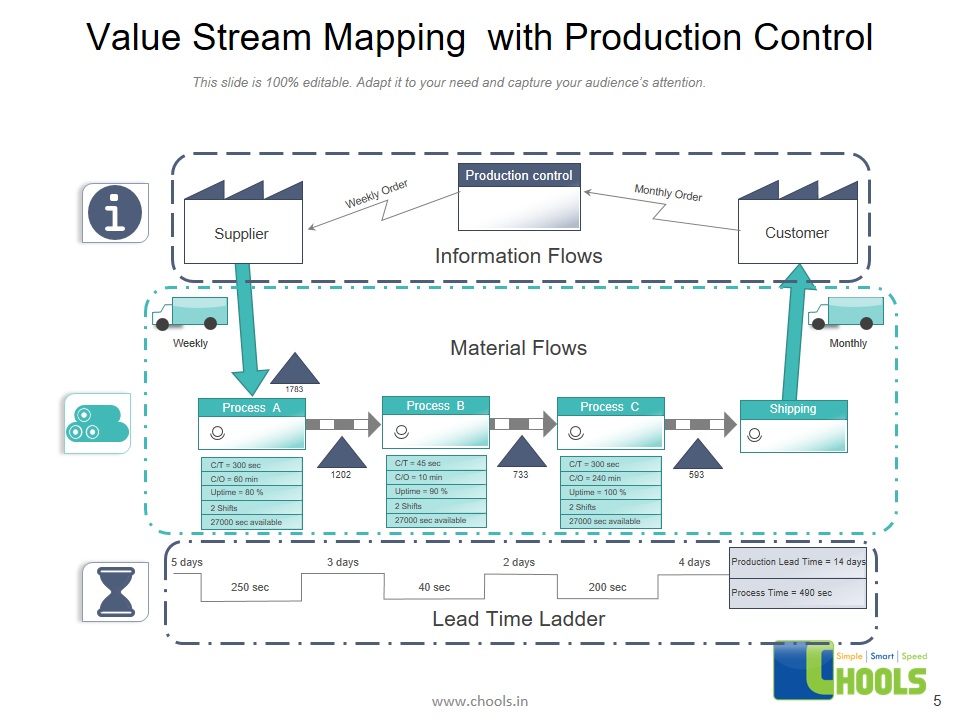
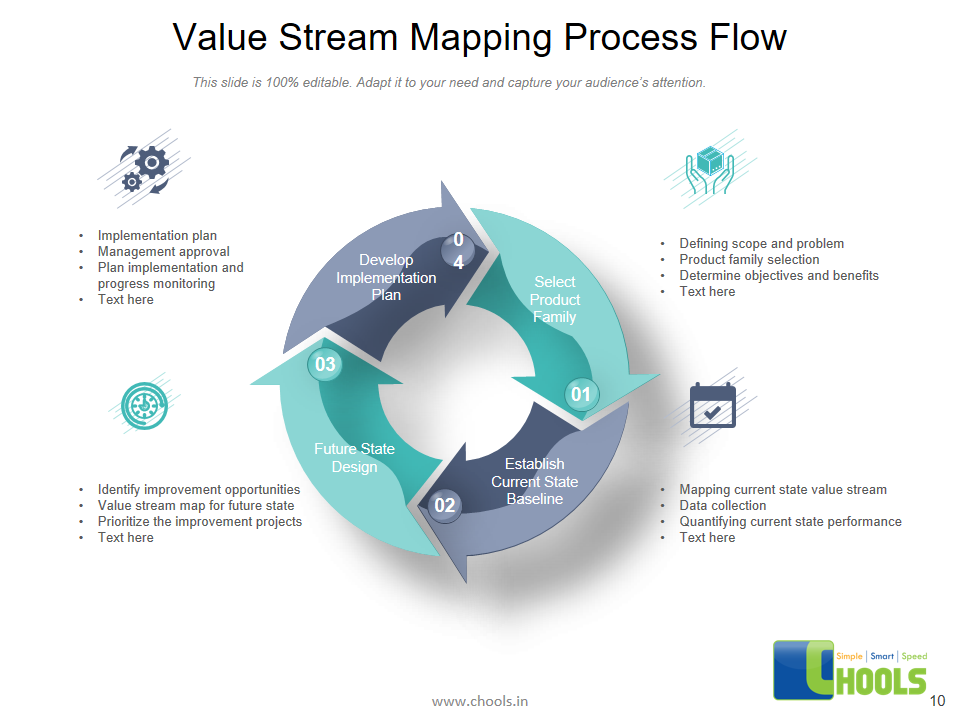
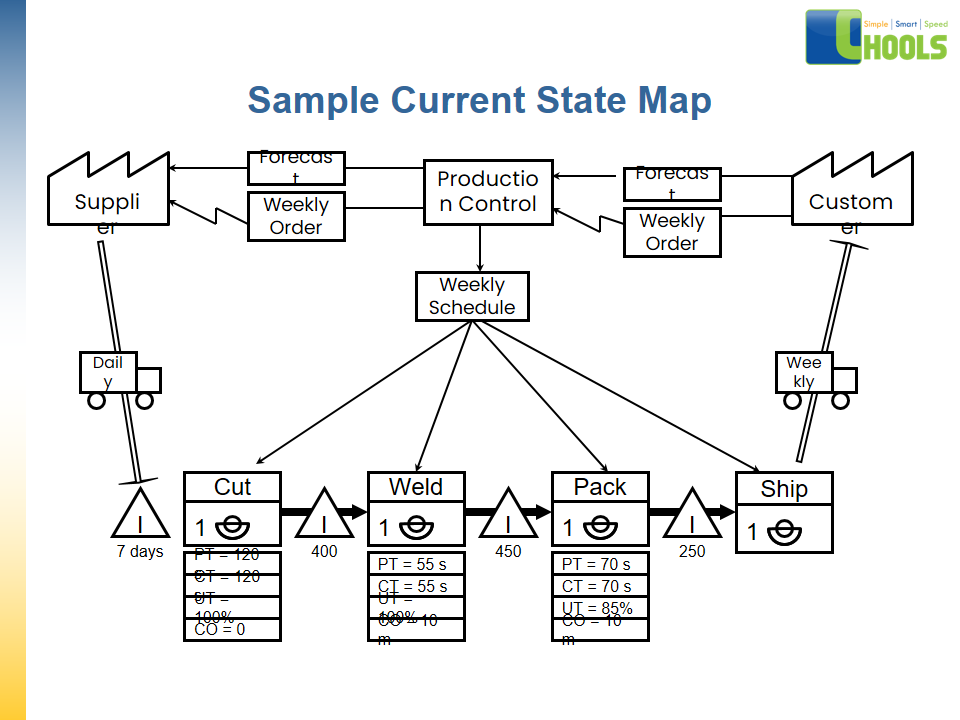
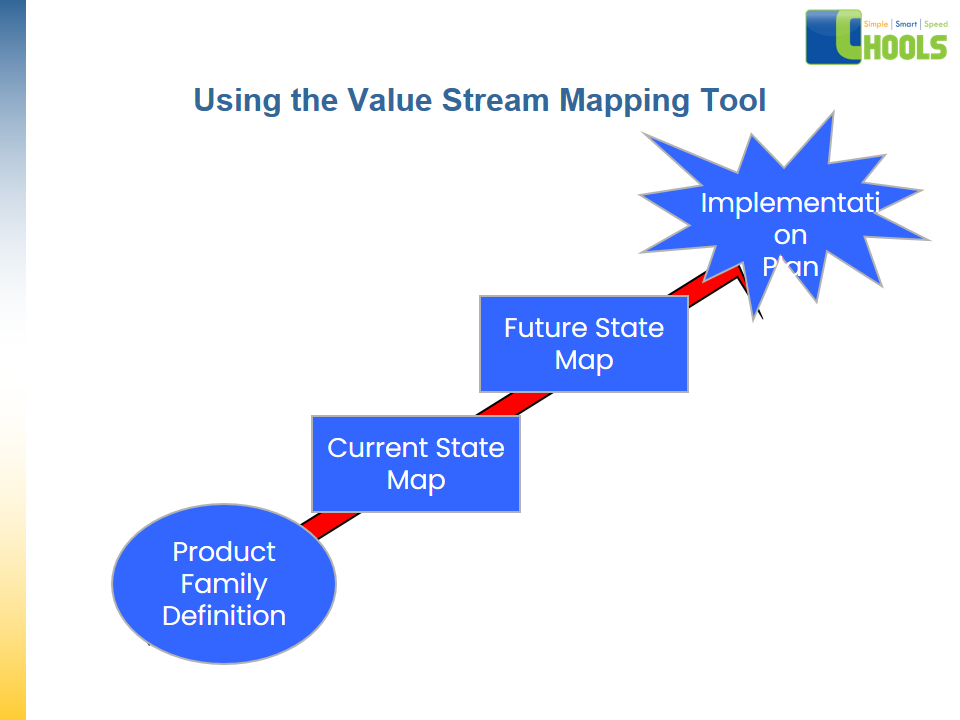
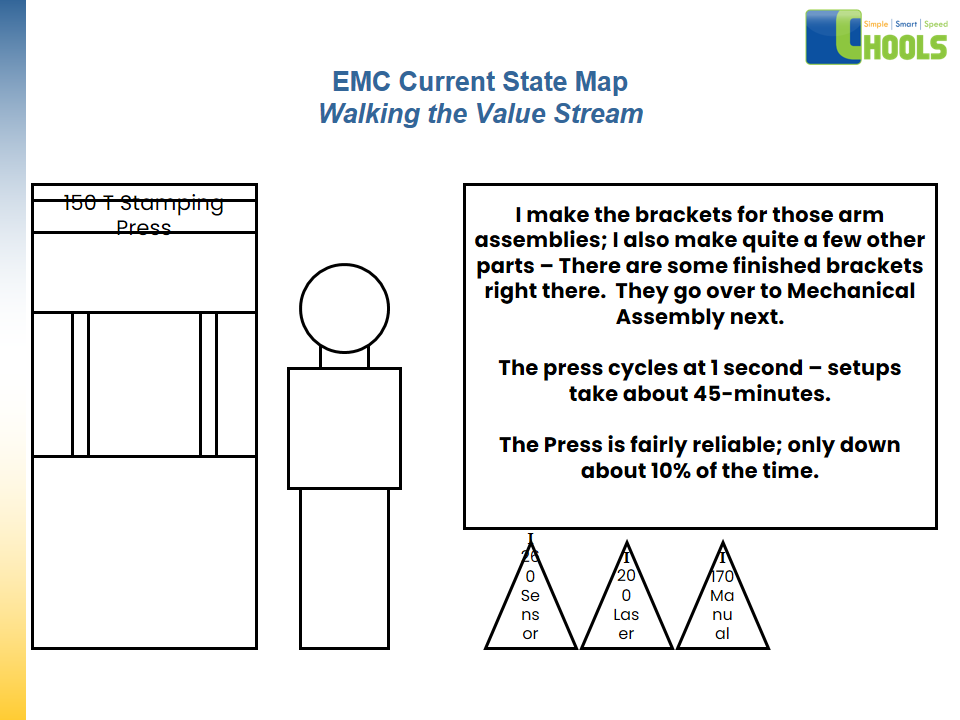
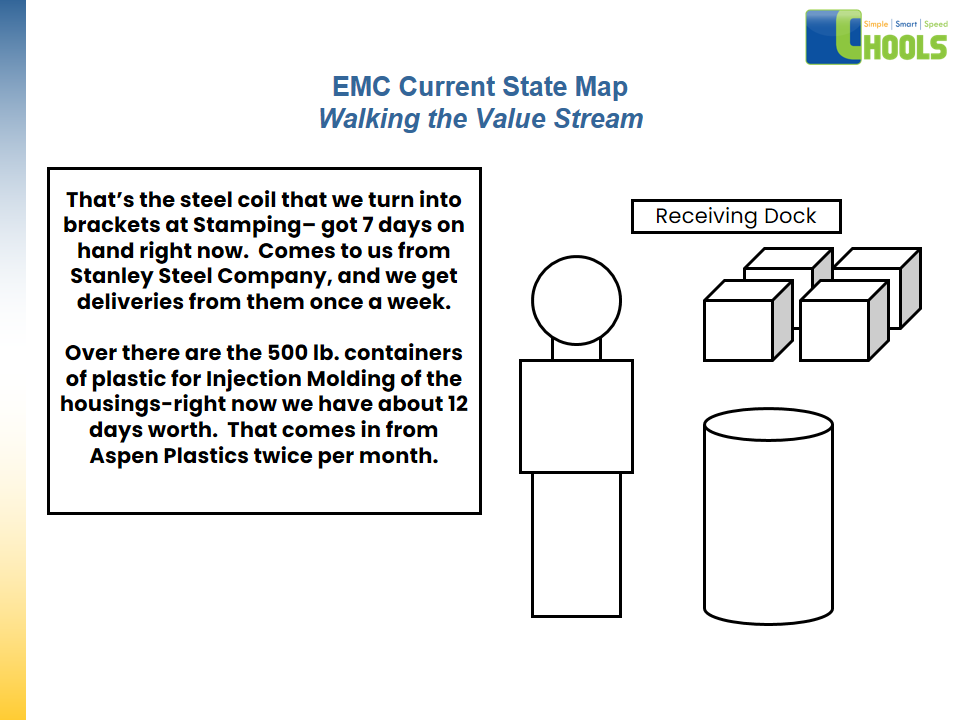
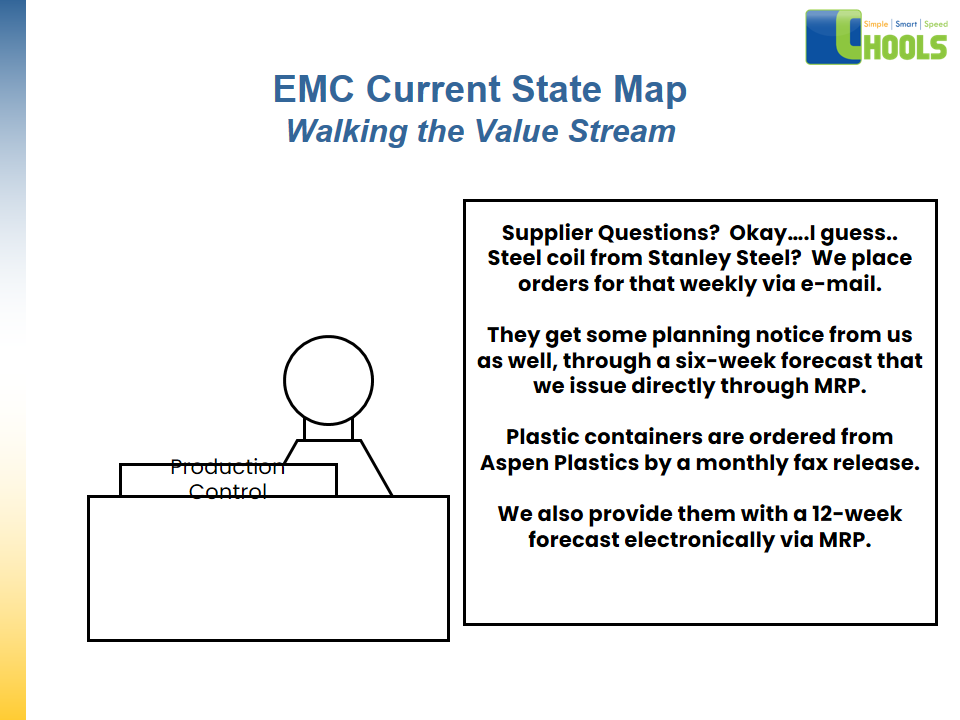
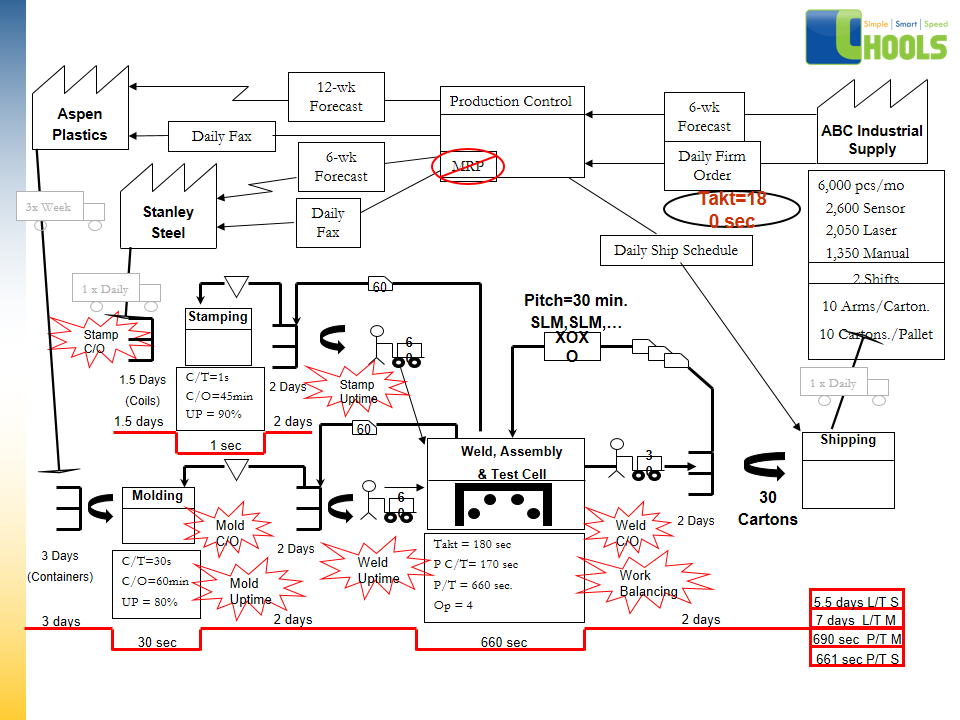
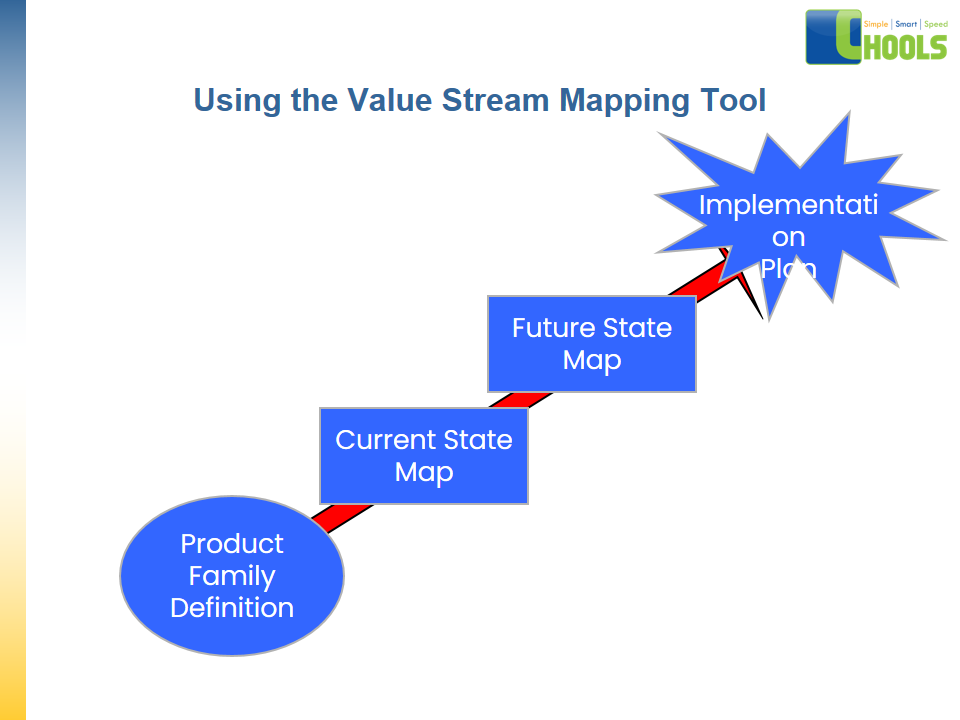
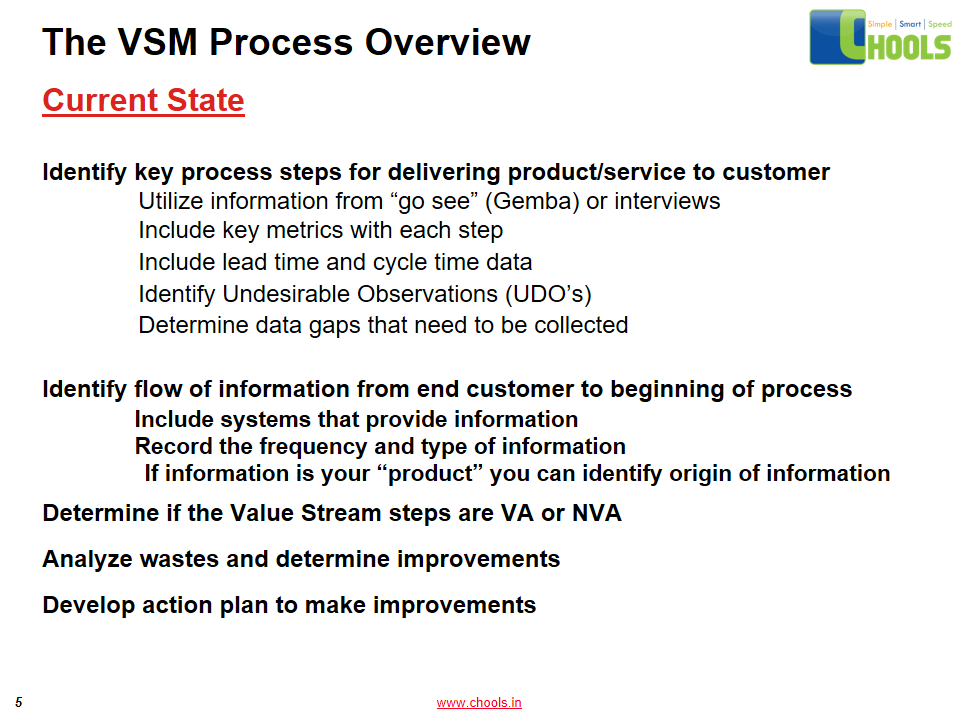
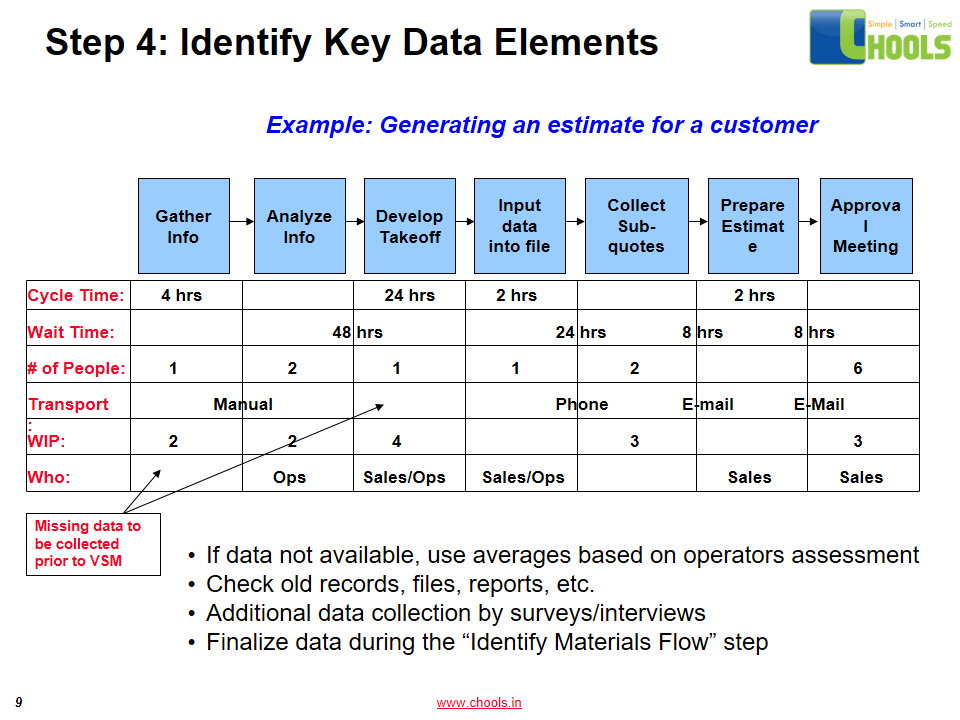
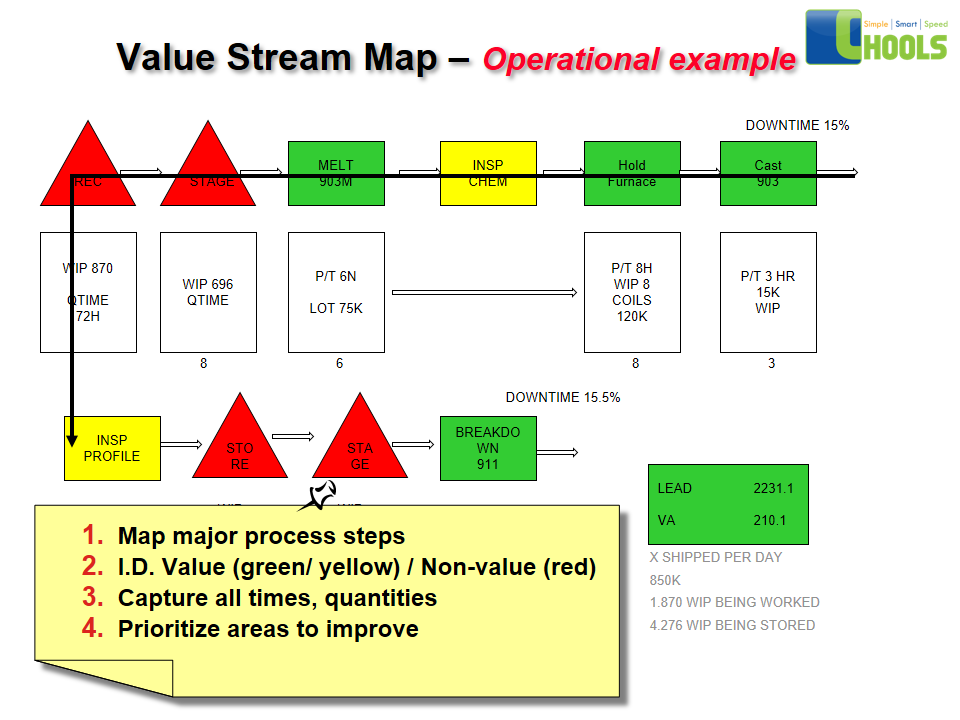
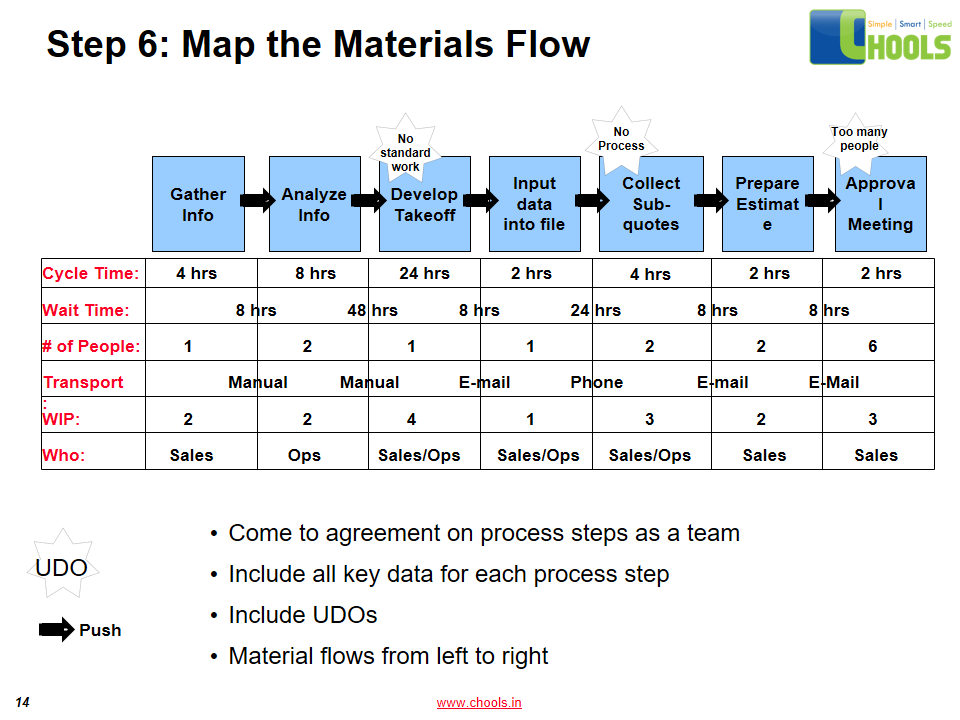
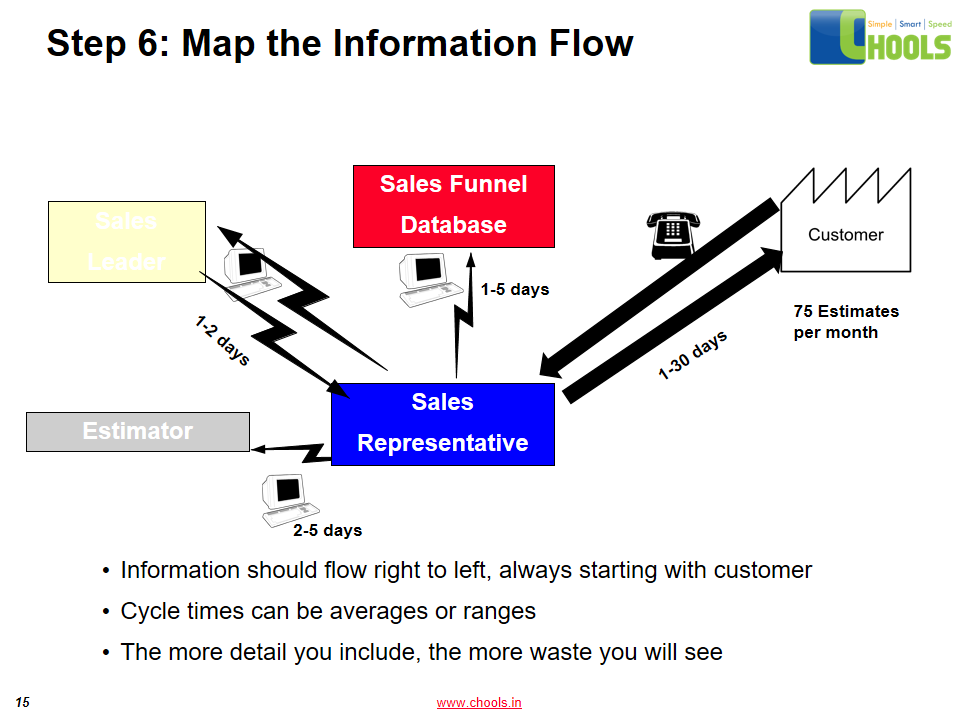
✔ Build a Current State Map for the selected process and simulate flow.
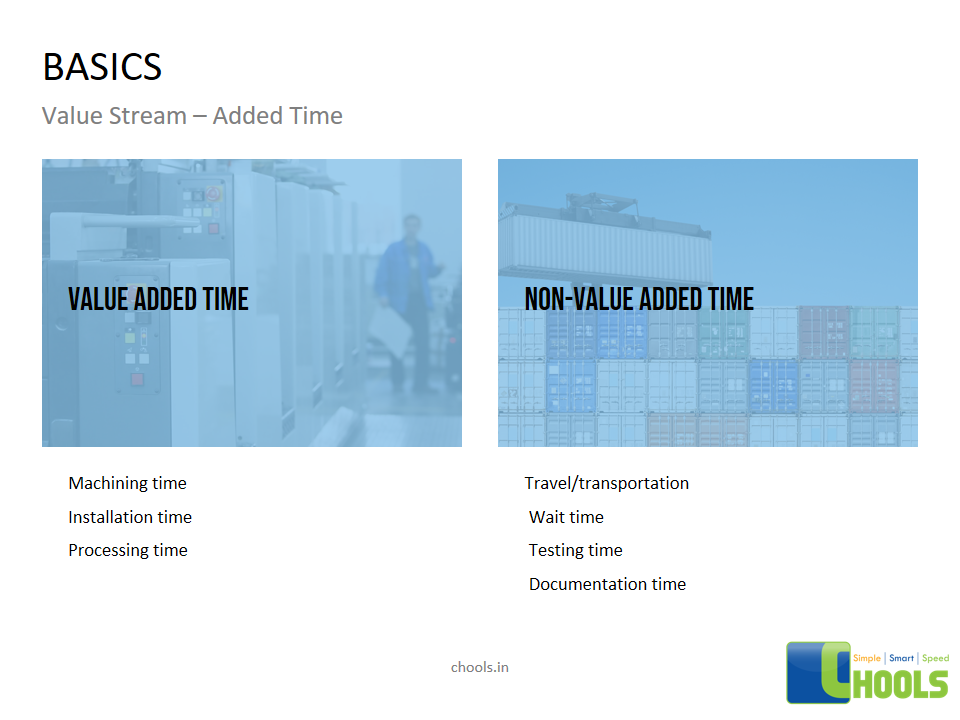
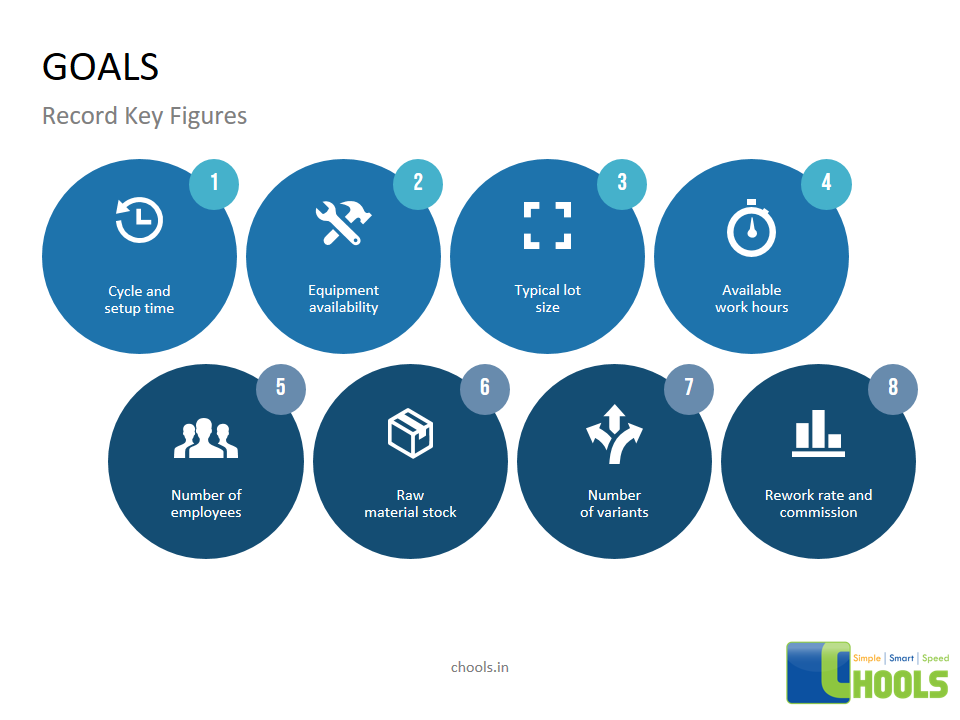
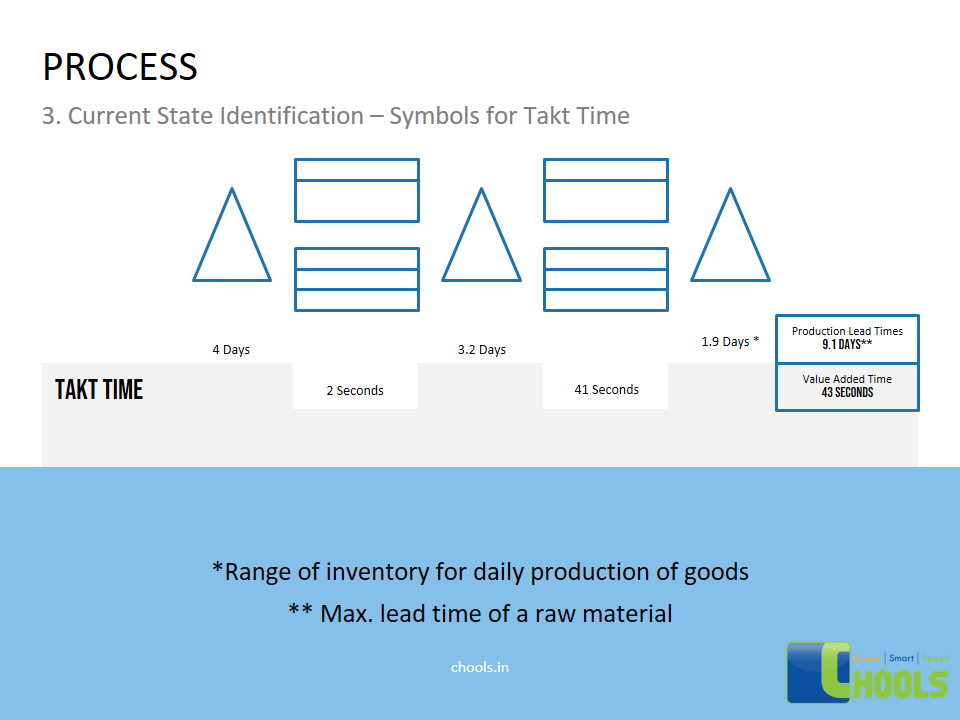
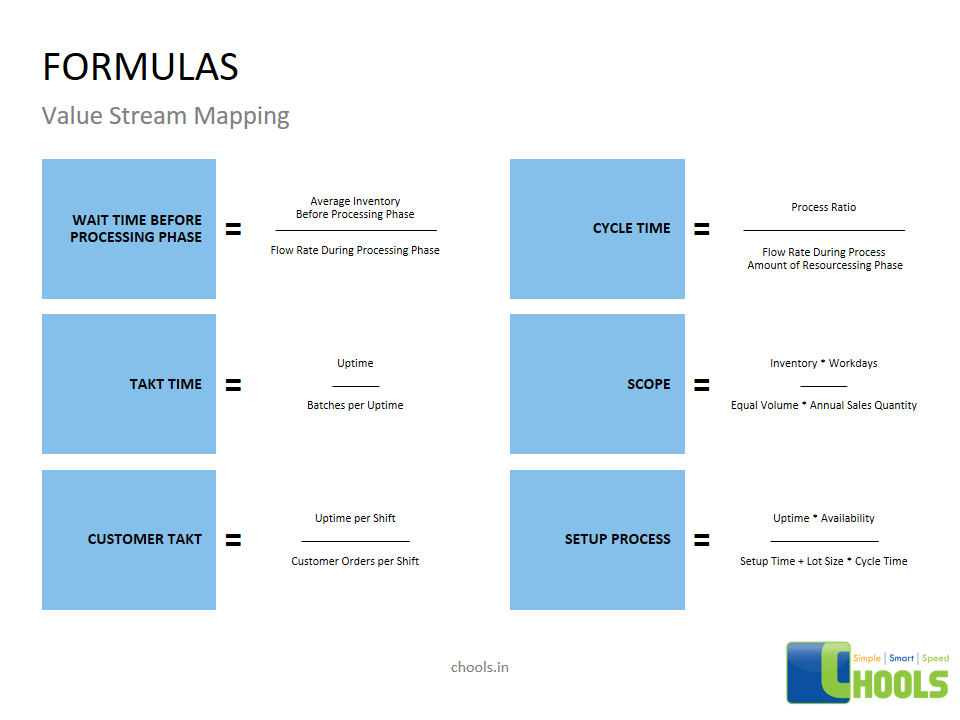
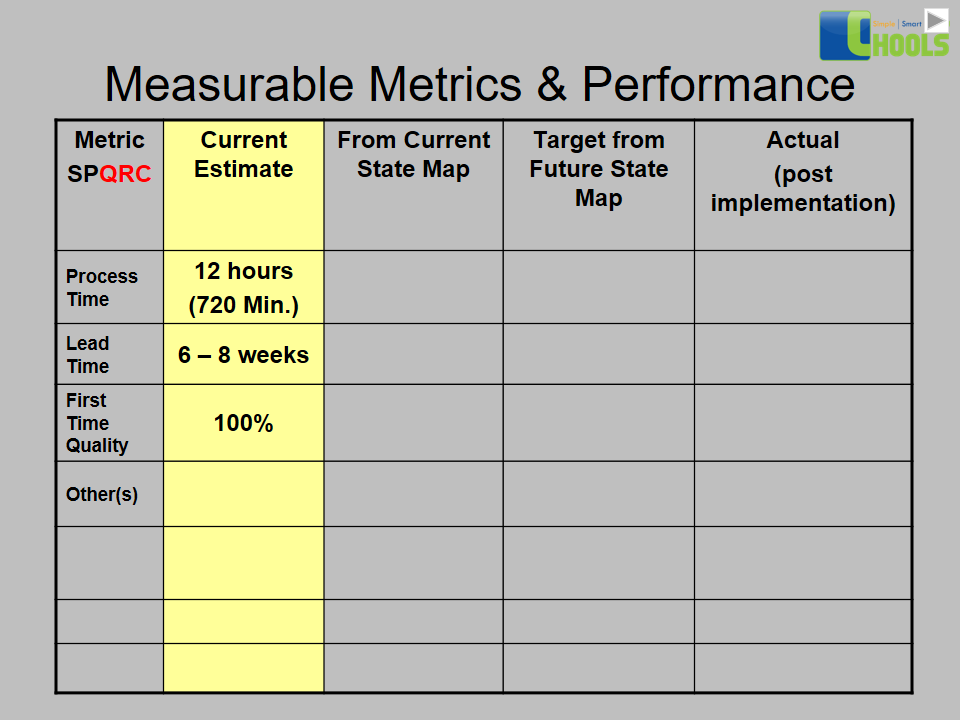
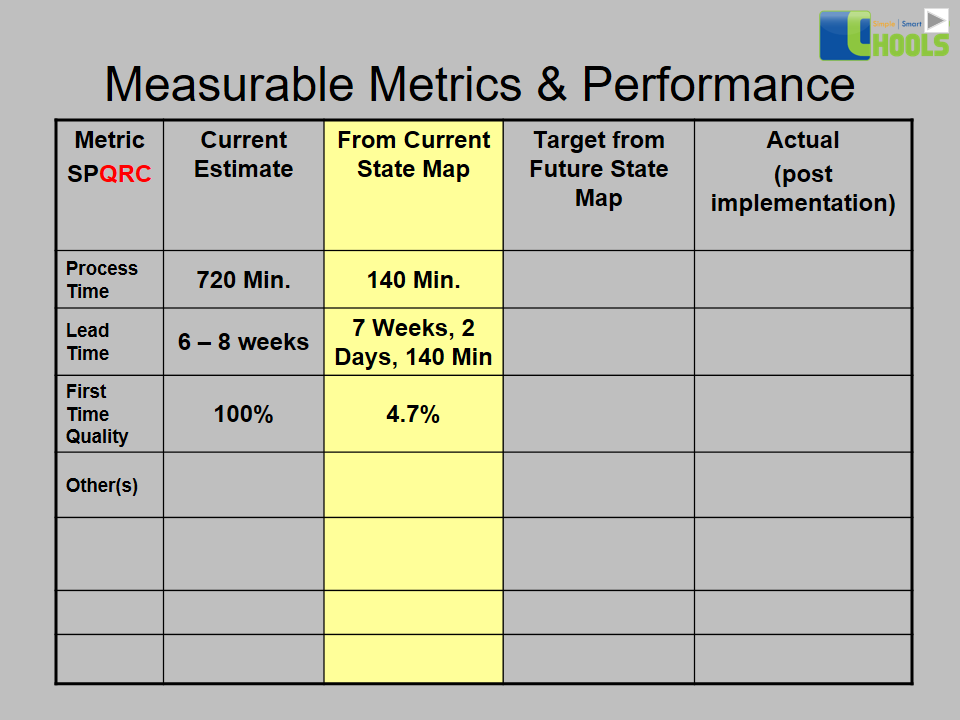
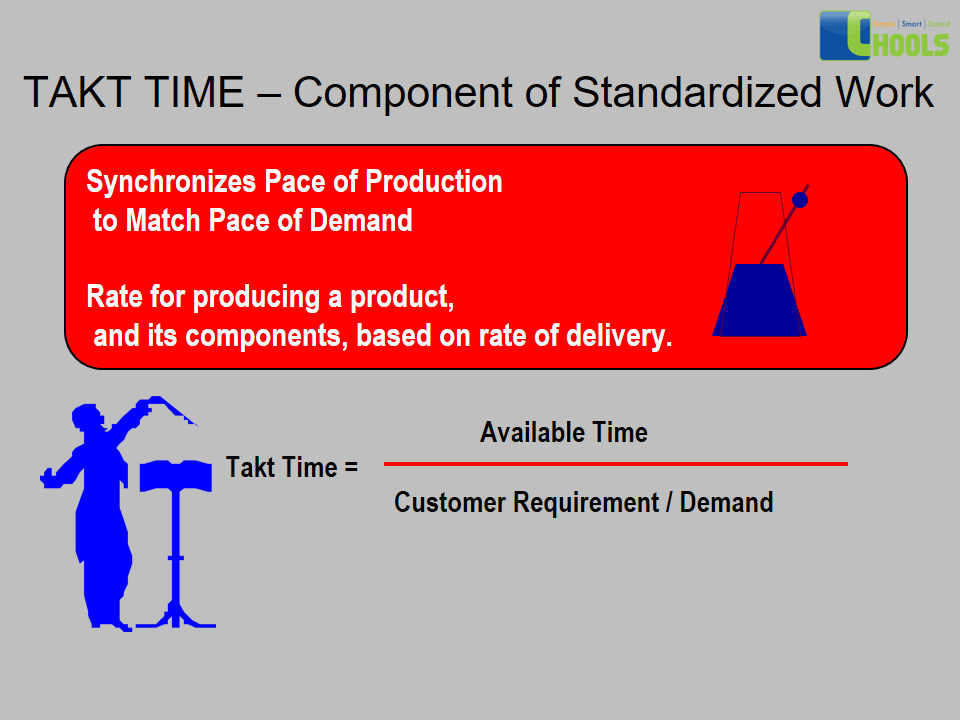
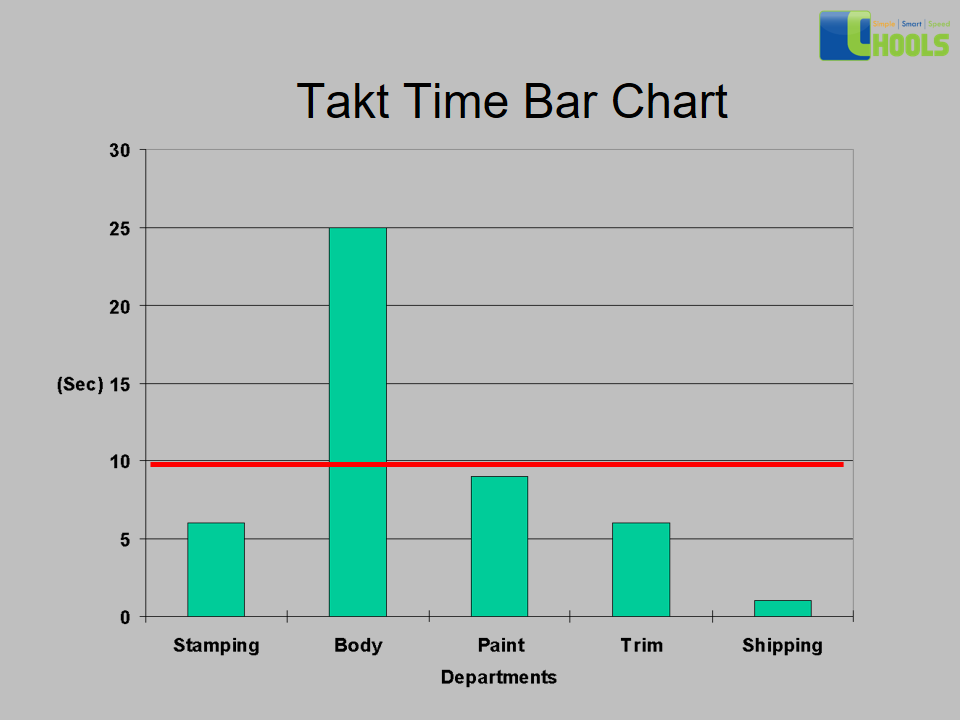
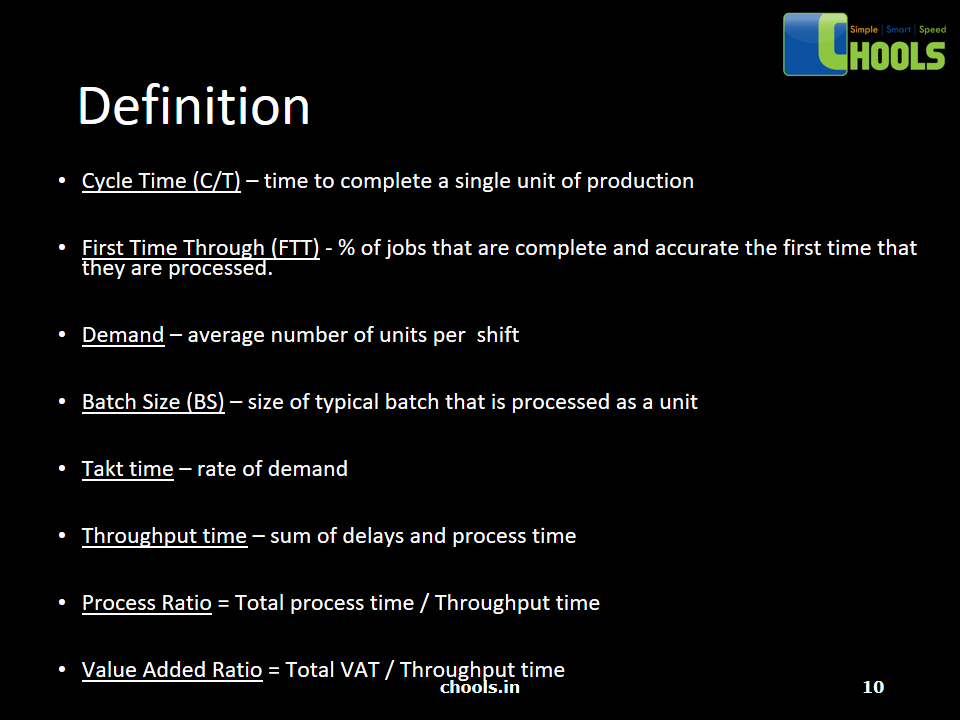
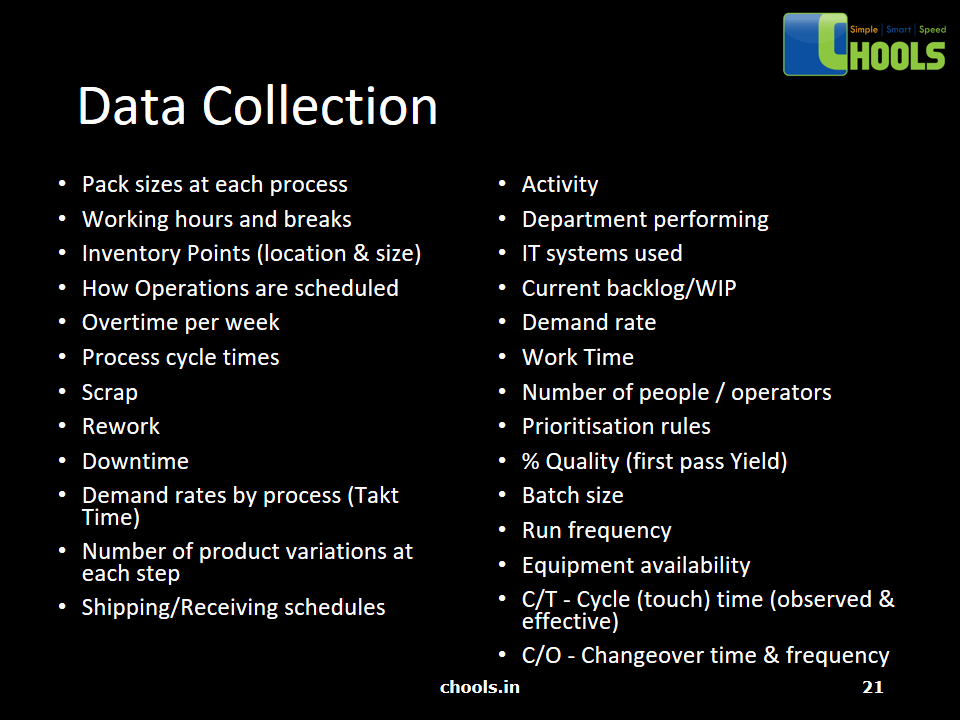
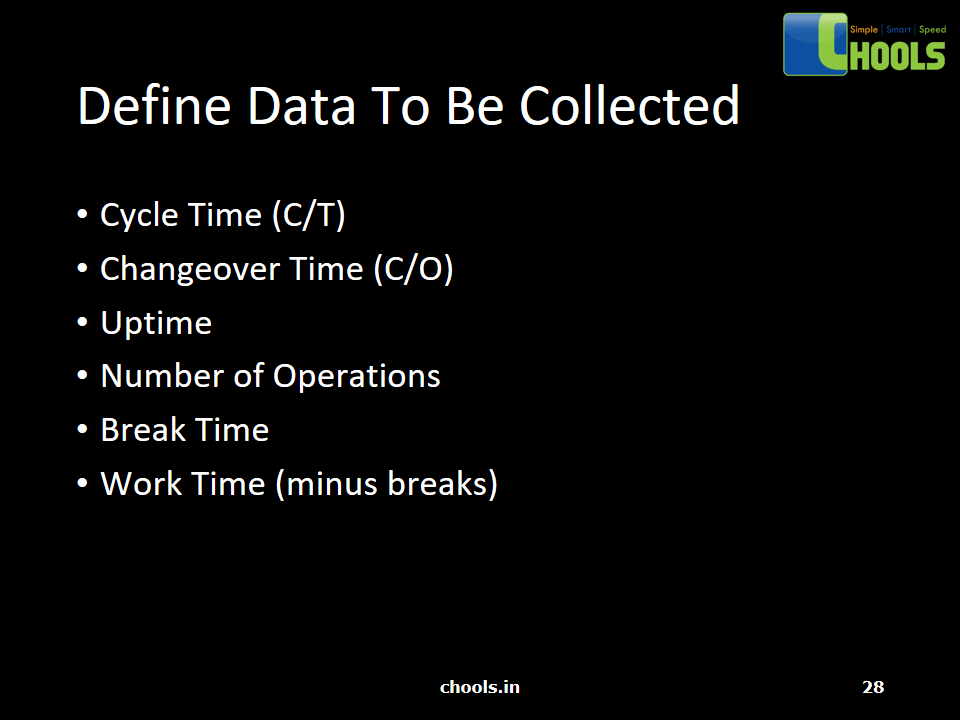
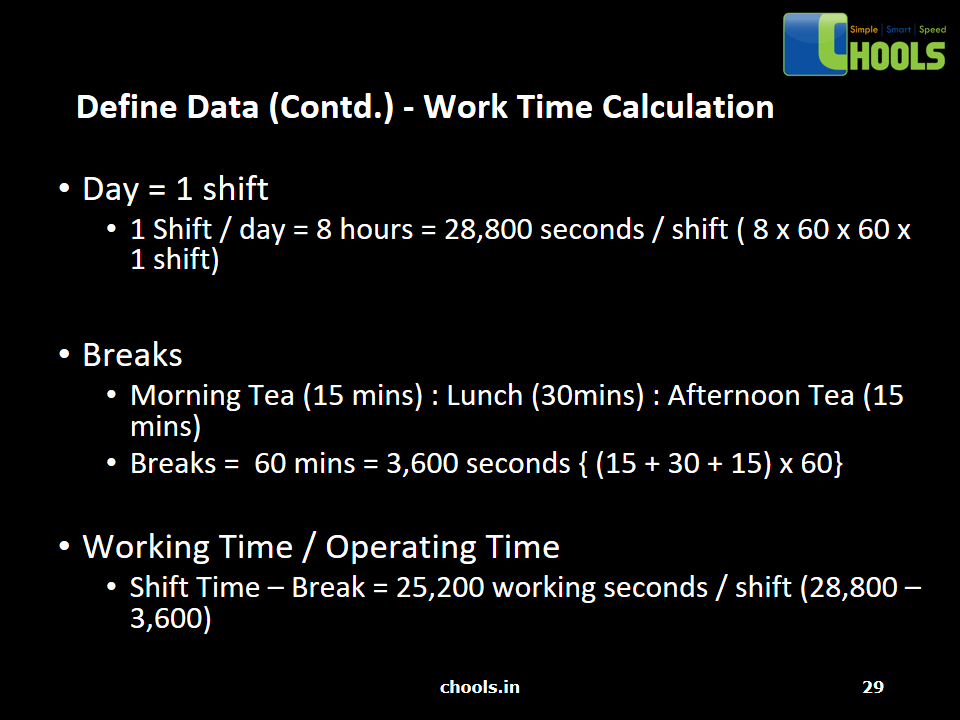
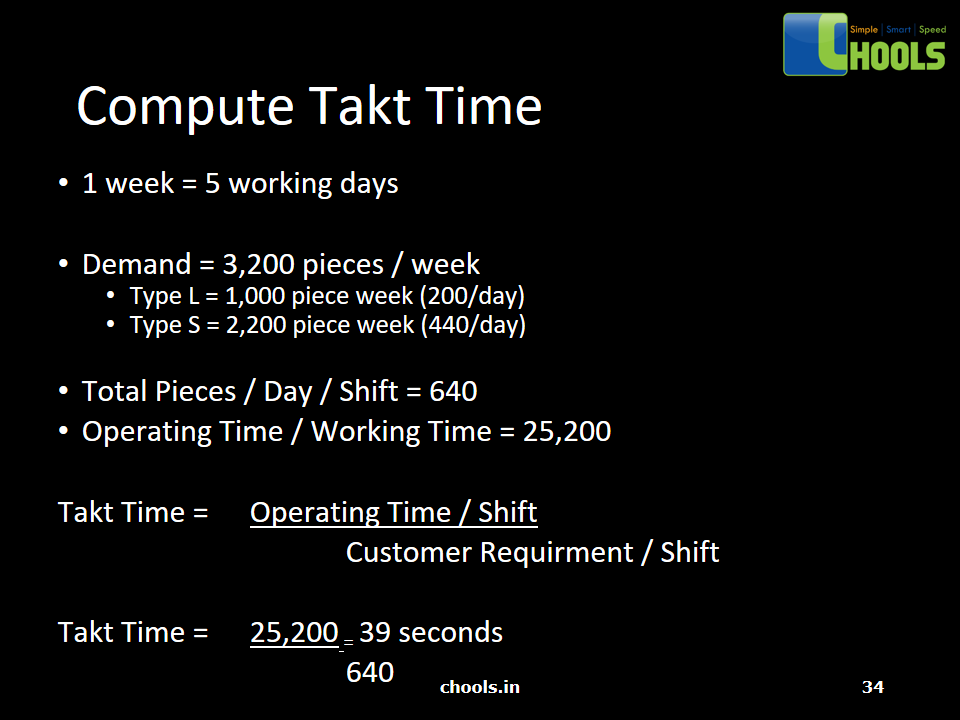
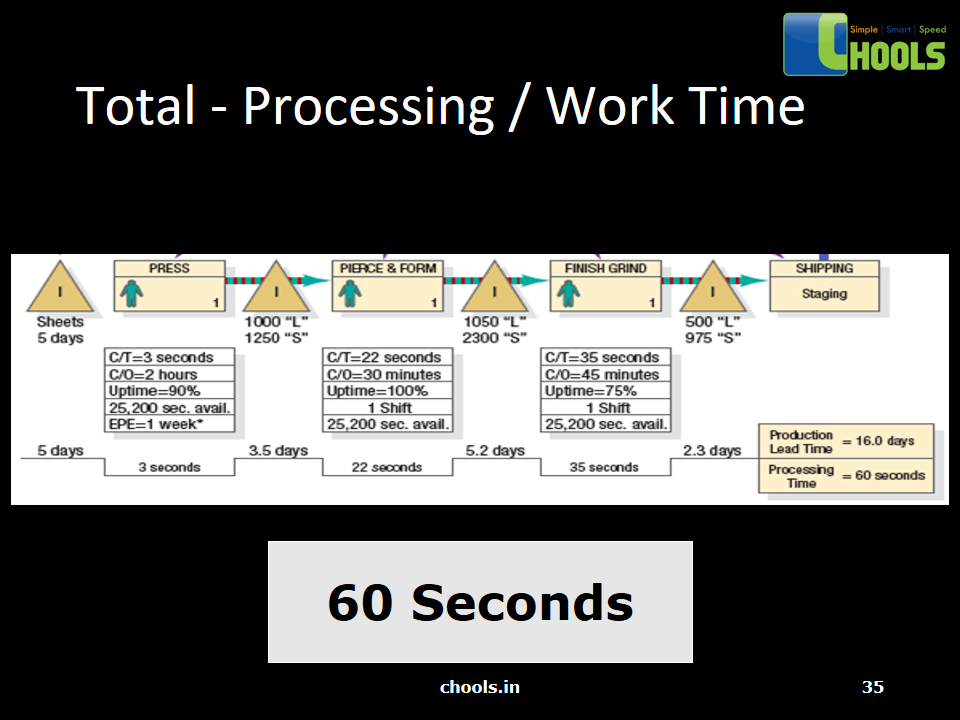
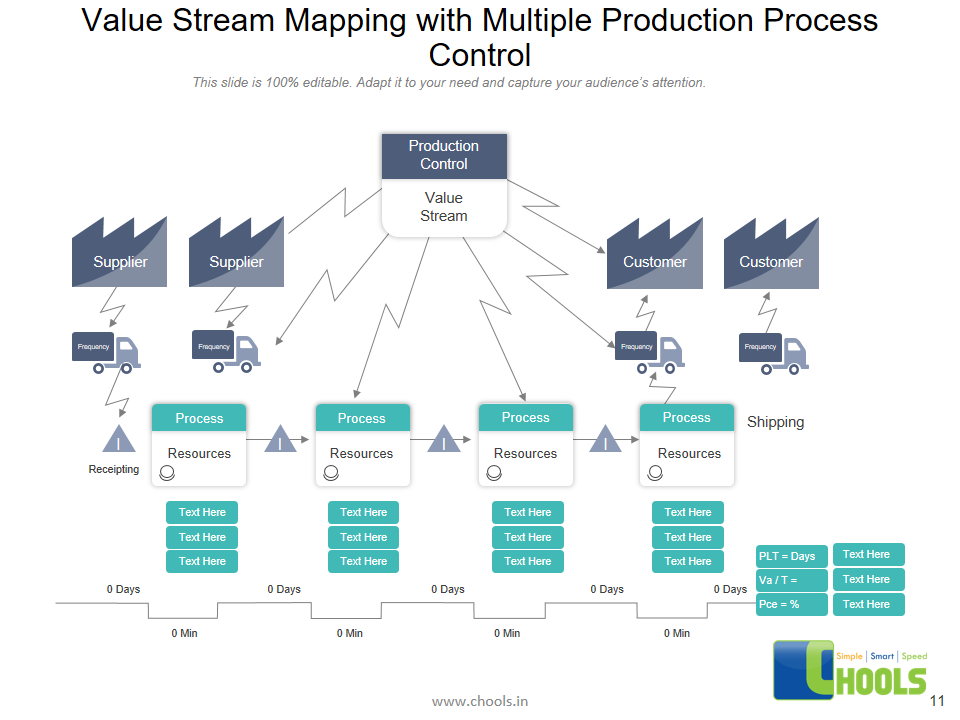
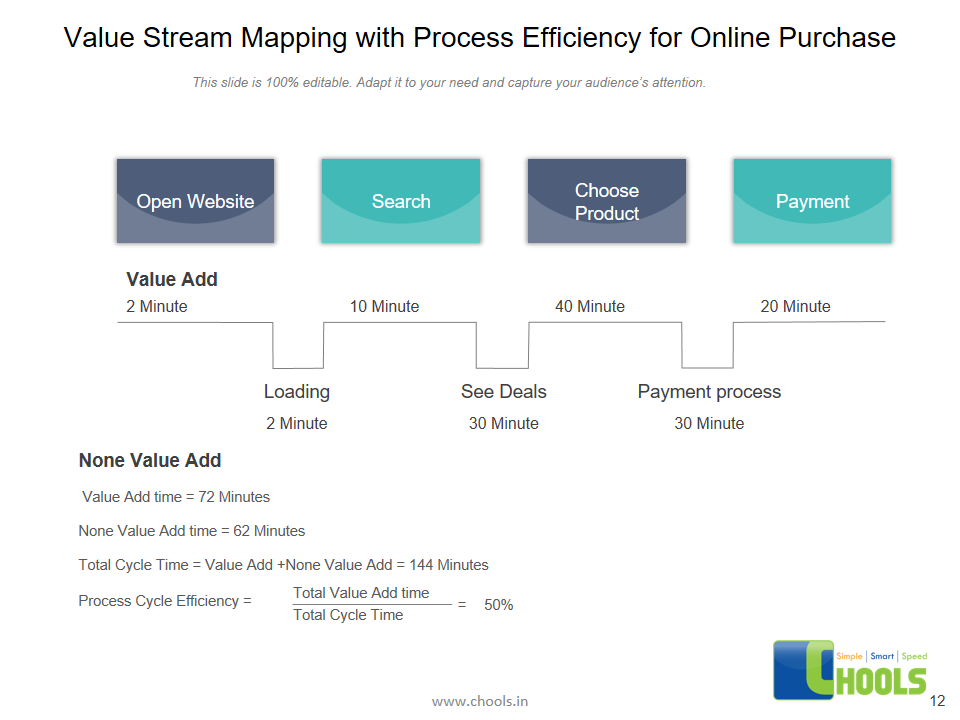
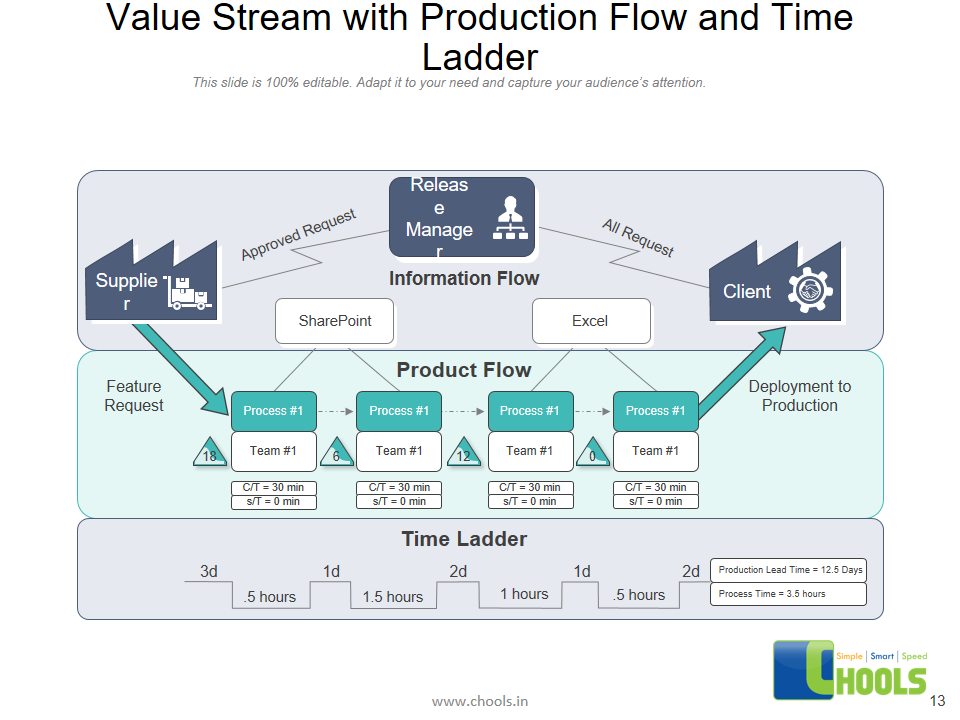
✔ Collect KPIs’ for each Step: VAT-value added time, L/T- Lead-time, C/T- Cycle time, T/t-Takt time, REL-
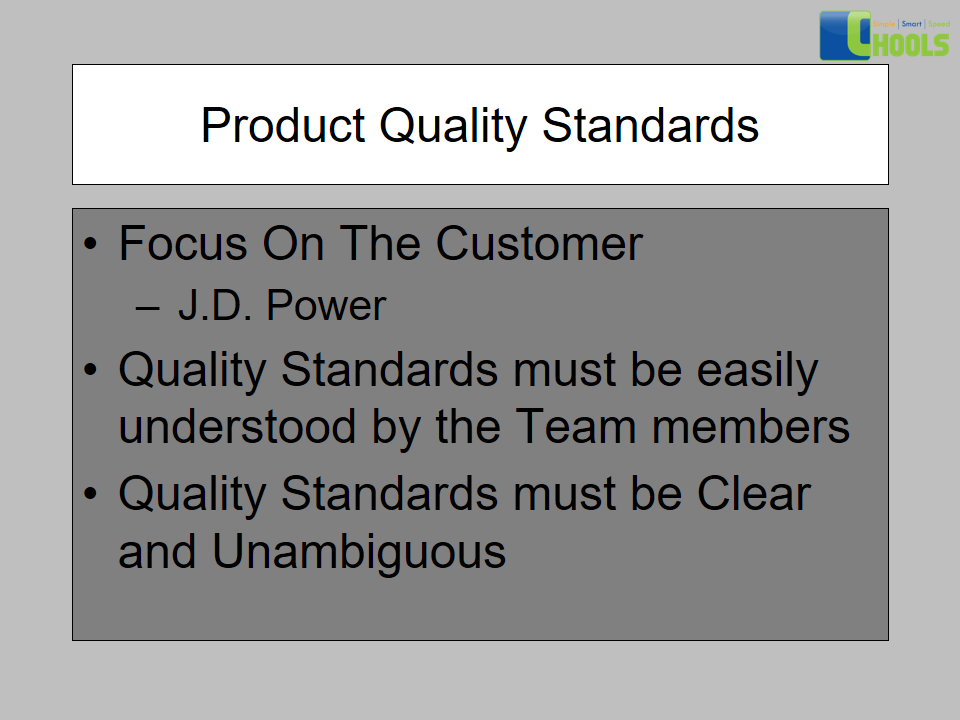
✔ Understand VOC, VOB, inputs, outputs of each process step.
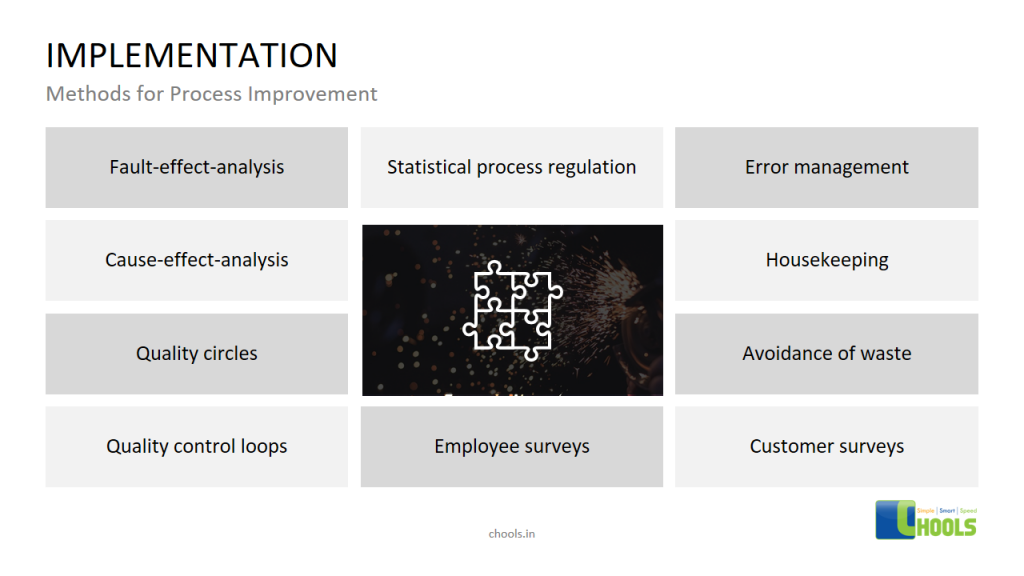
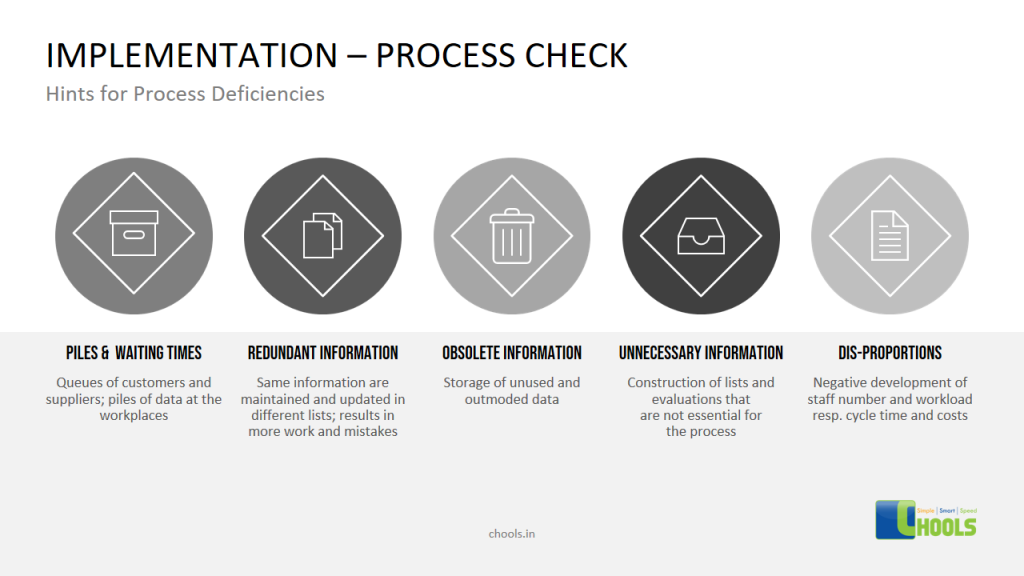
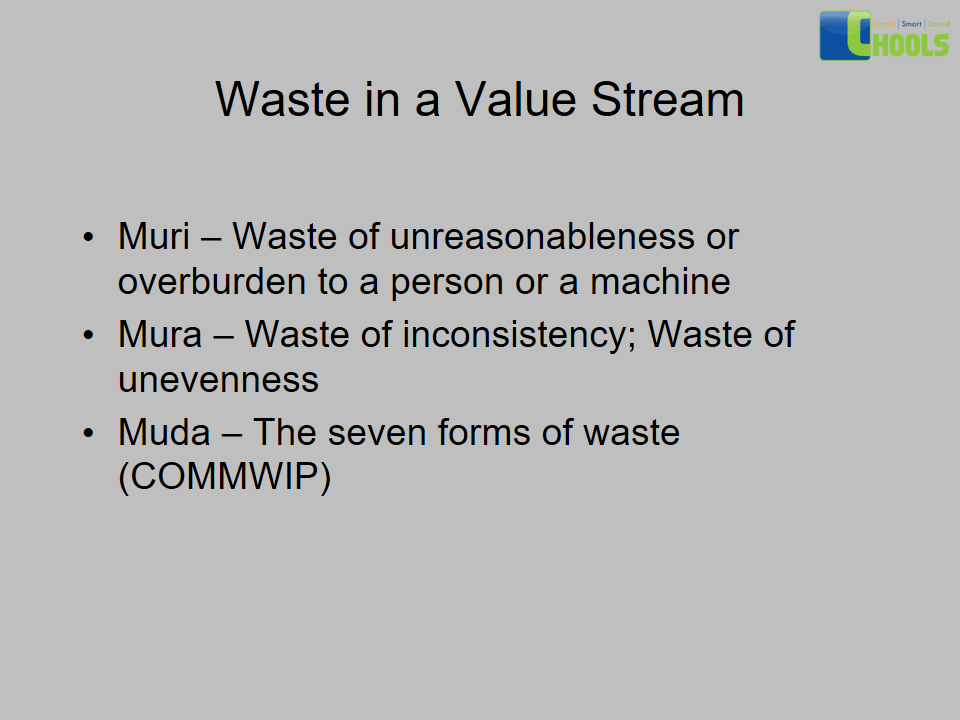
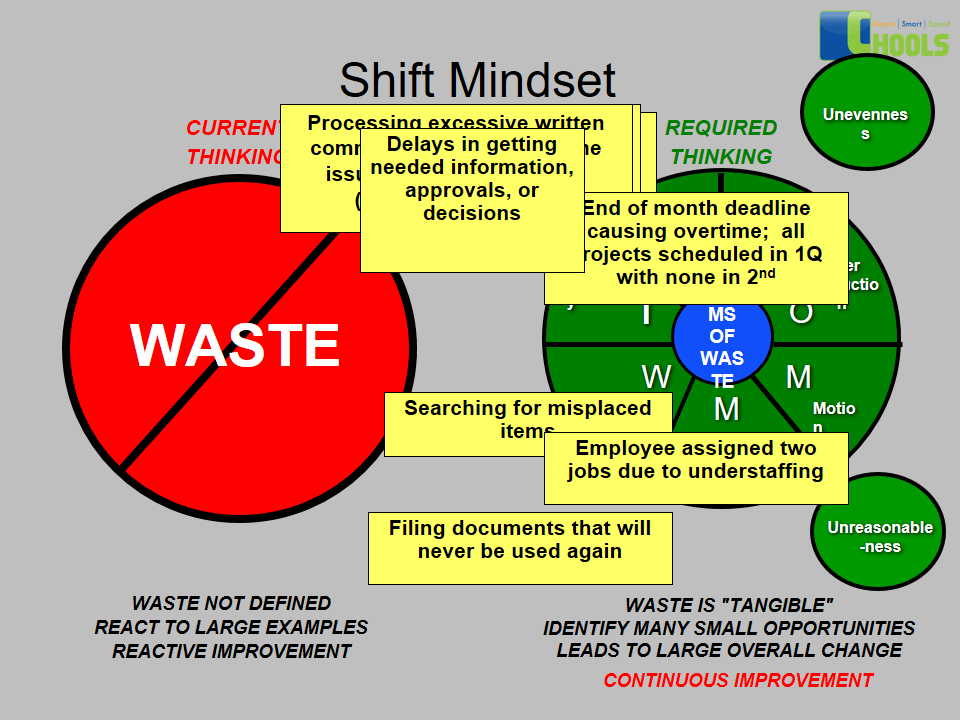
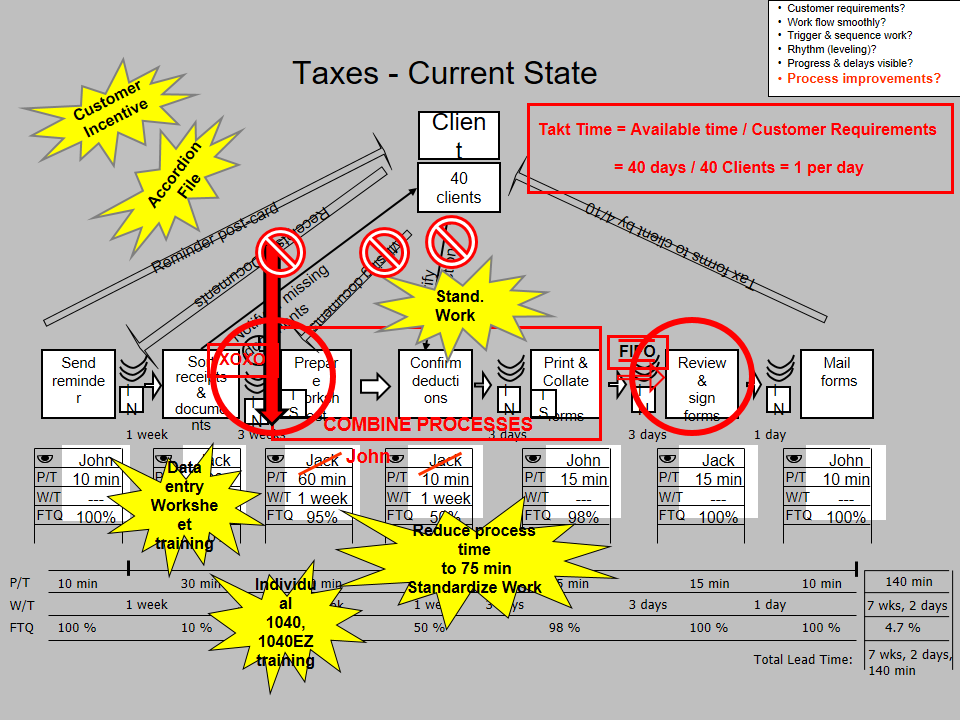
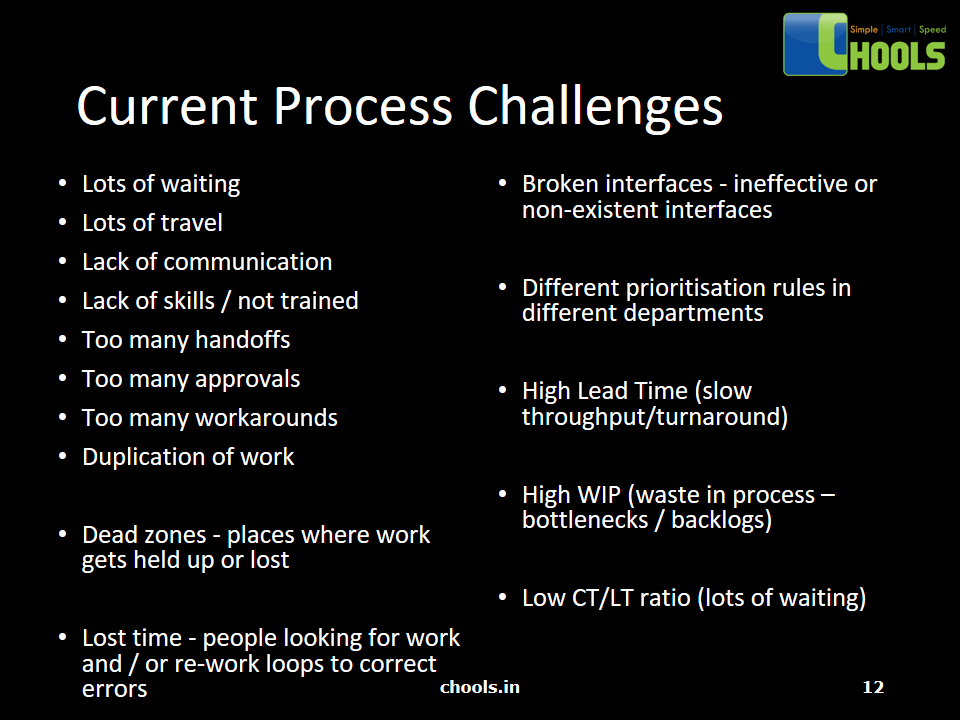
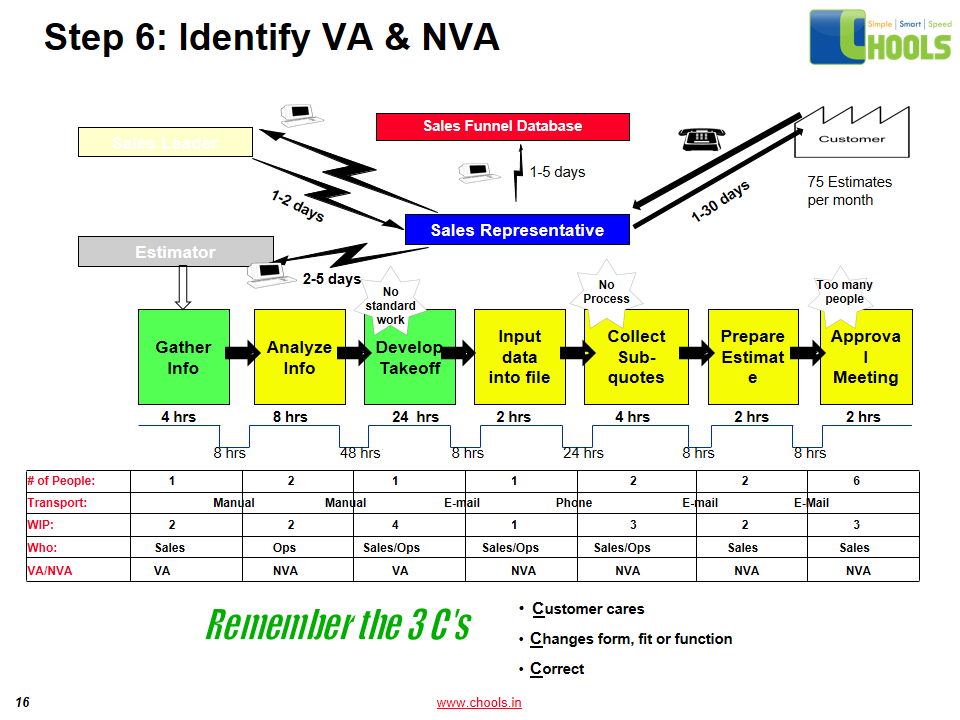
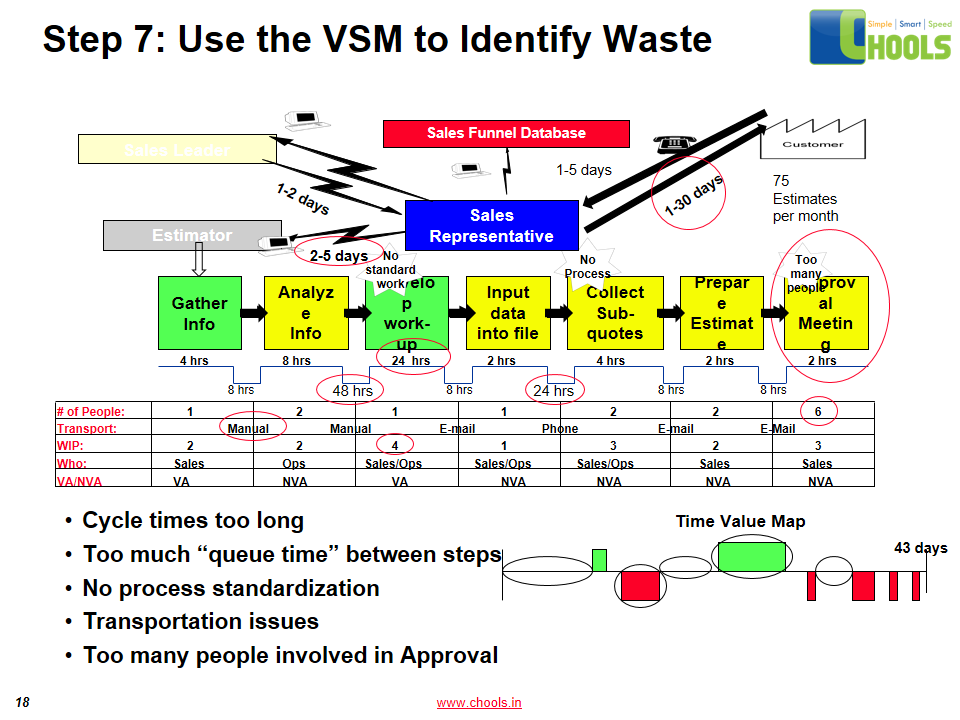
✔ Understand the 8 Wastes Types and identify sources and locations of waste.
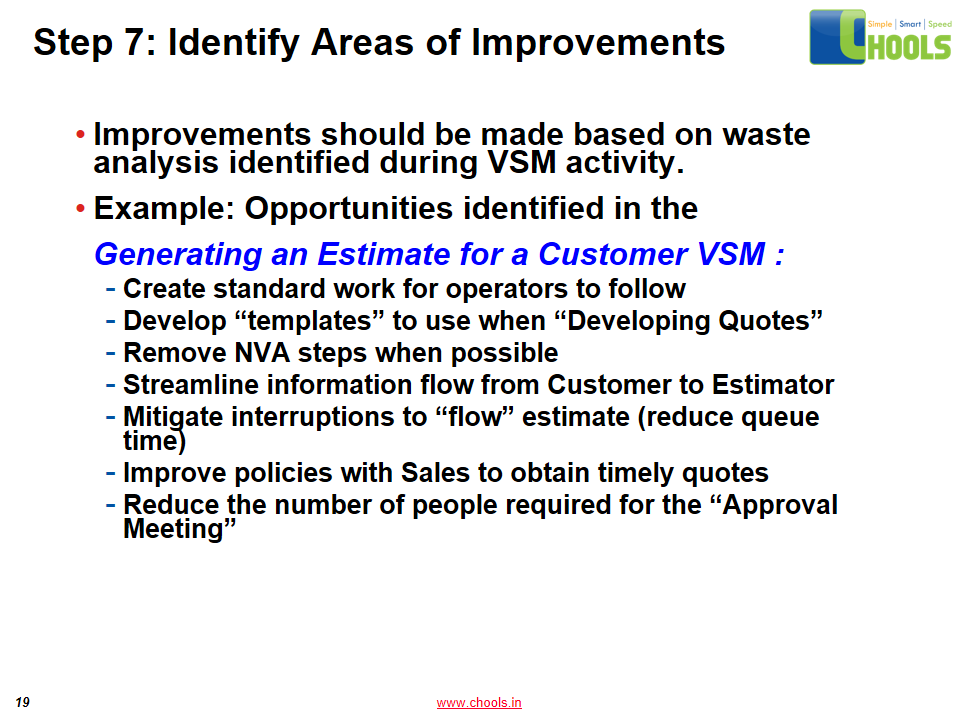
✔ Identify opportunities to eliminate wastes and optimize processes to meet VOC and VOB.
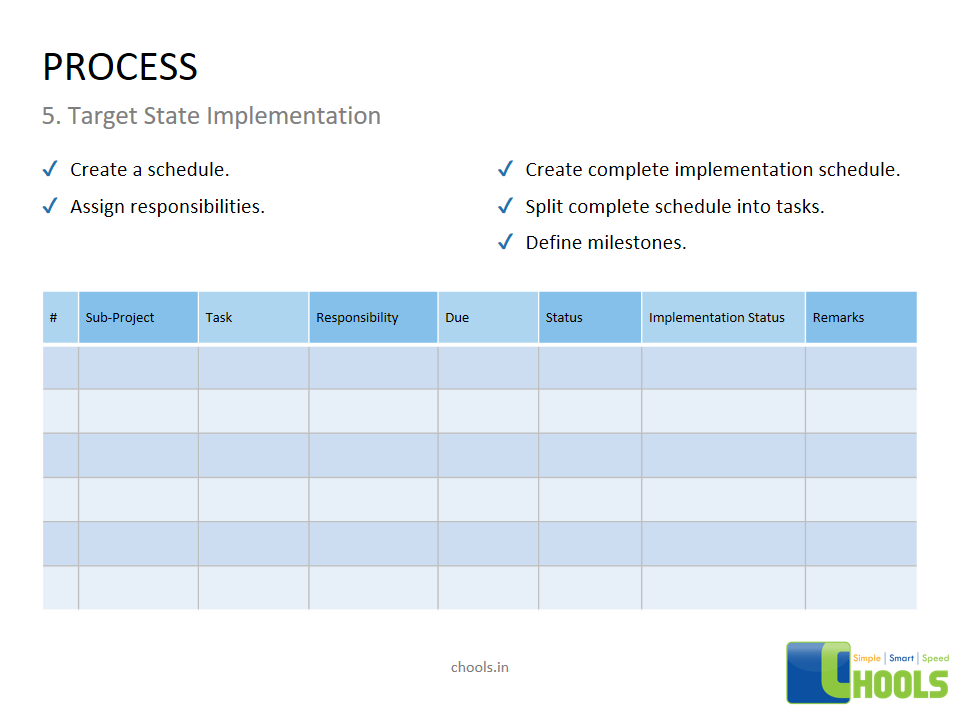
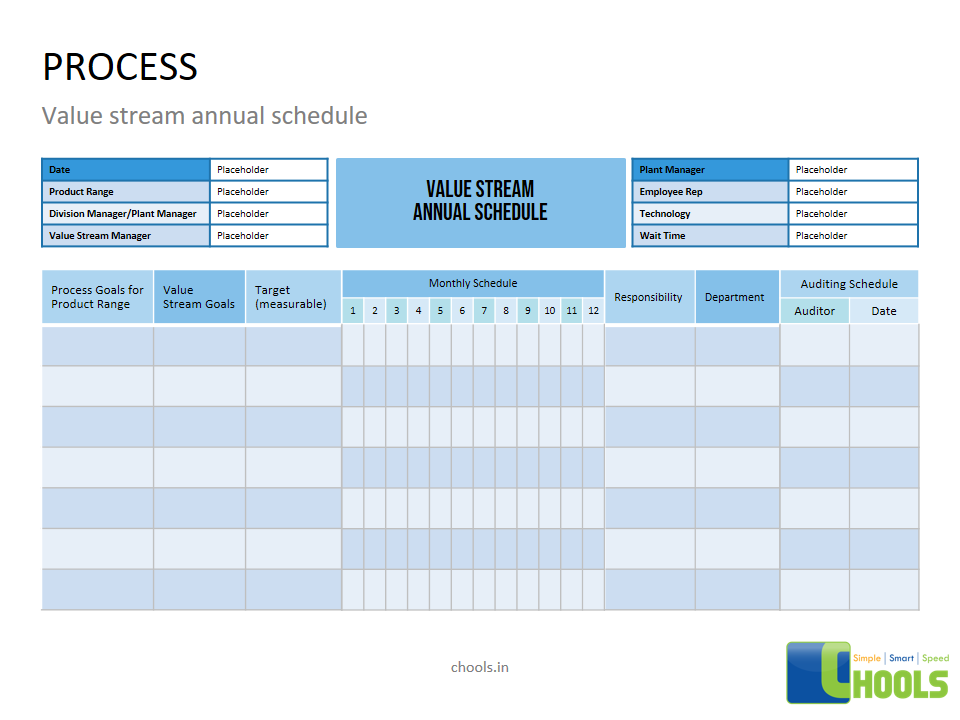
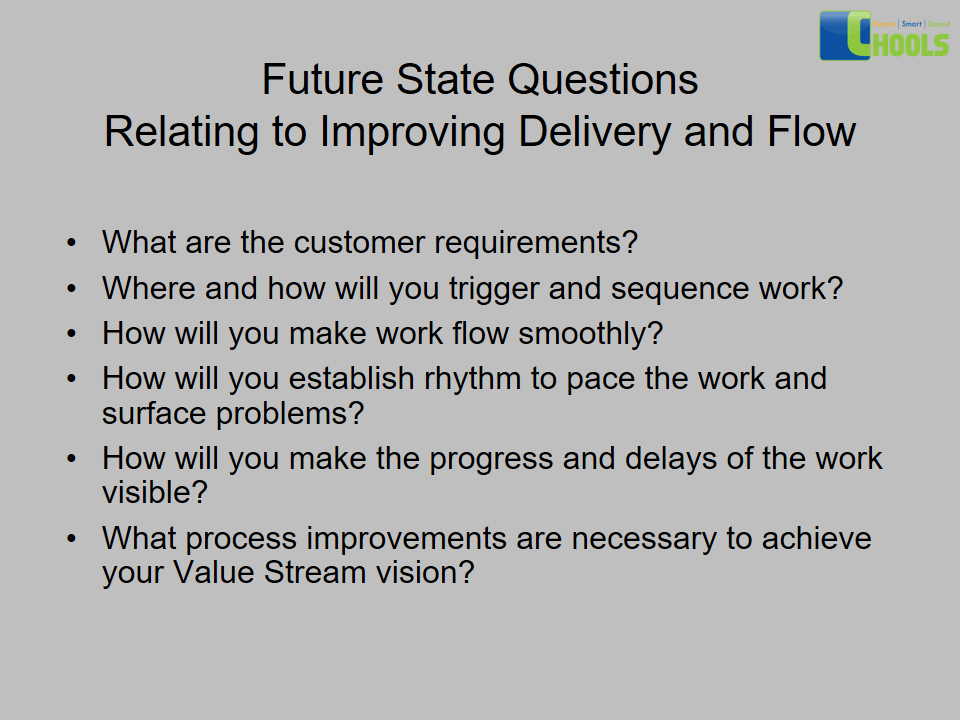
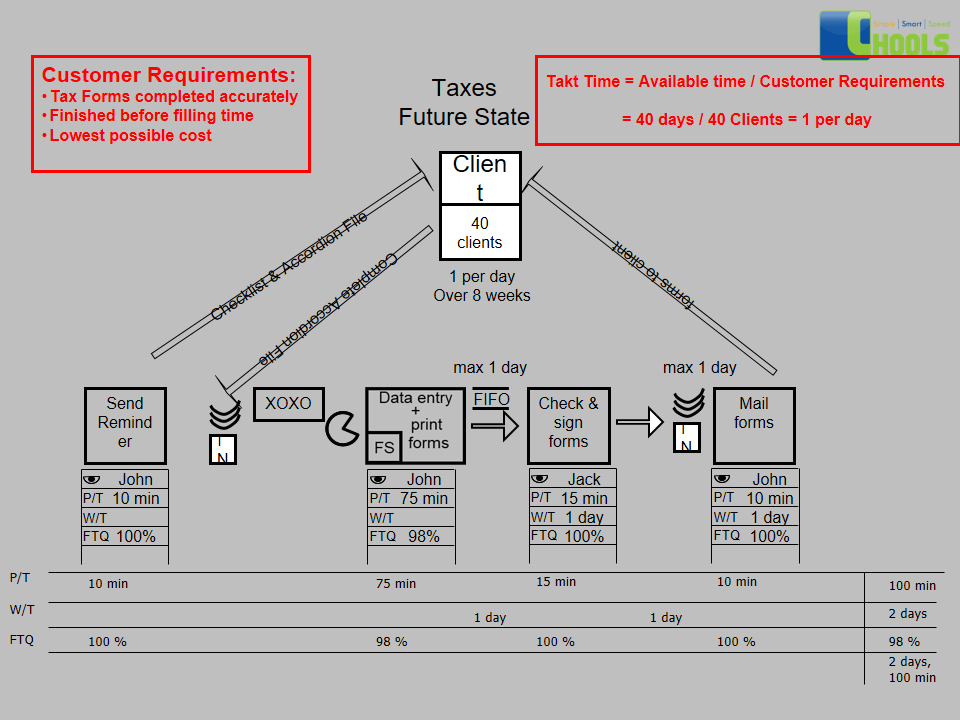
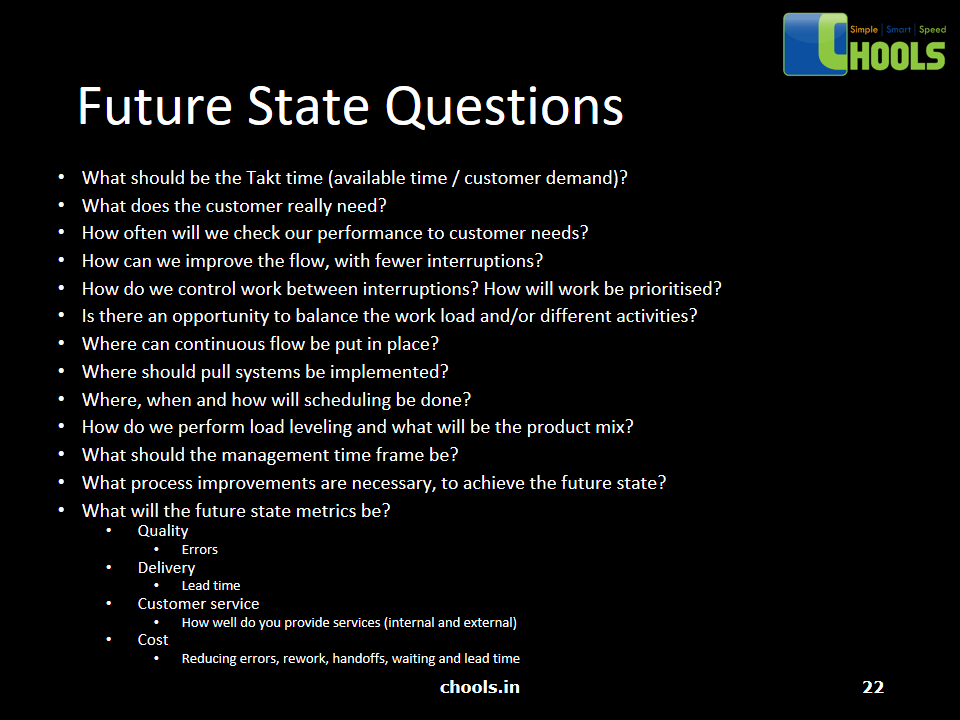
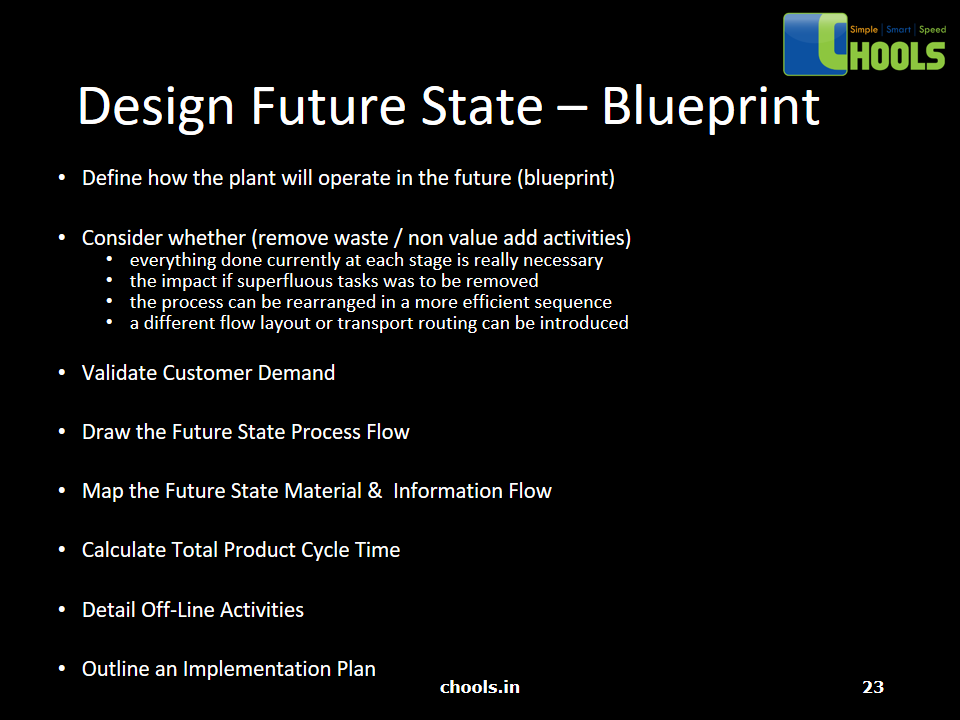
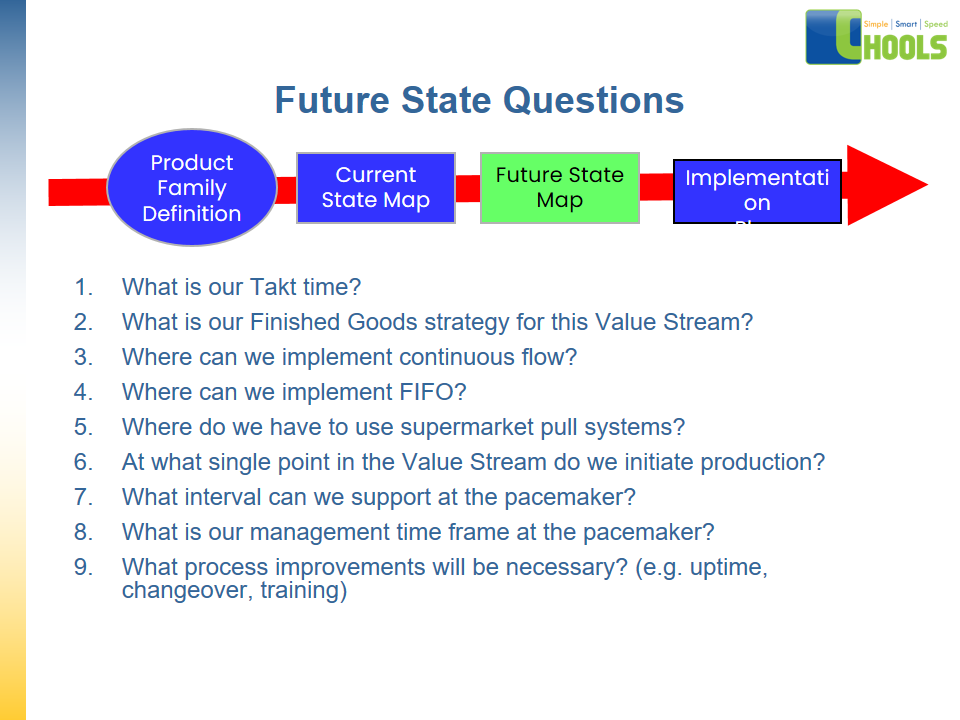
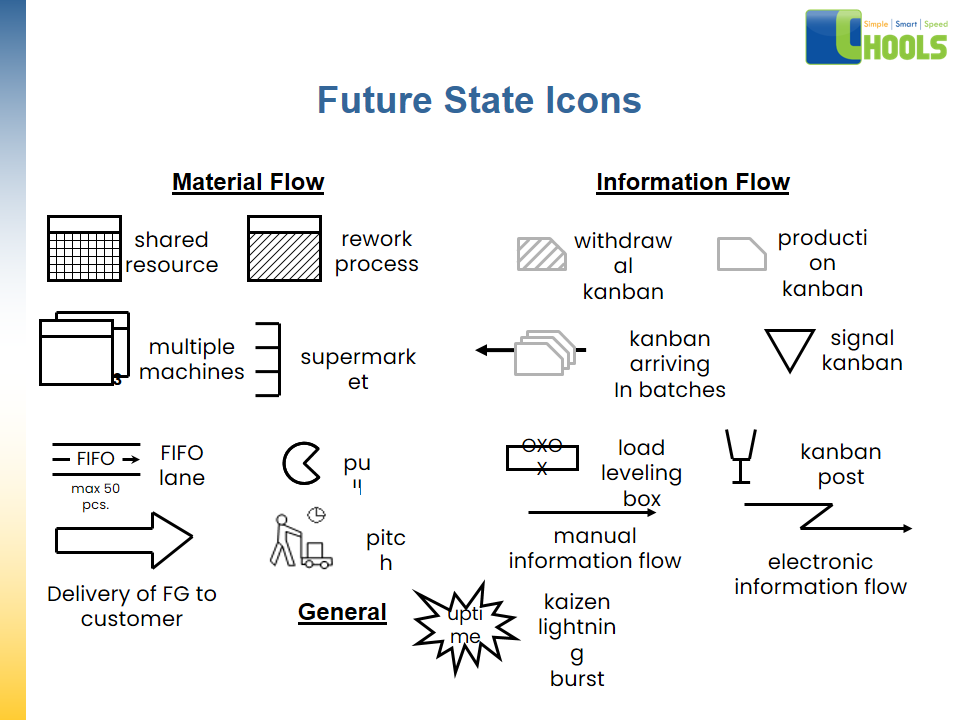
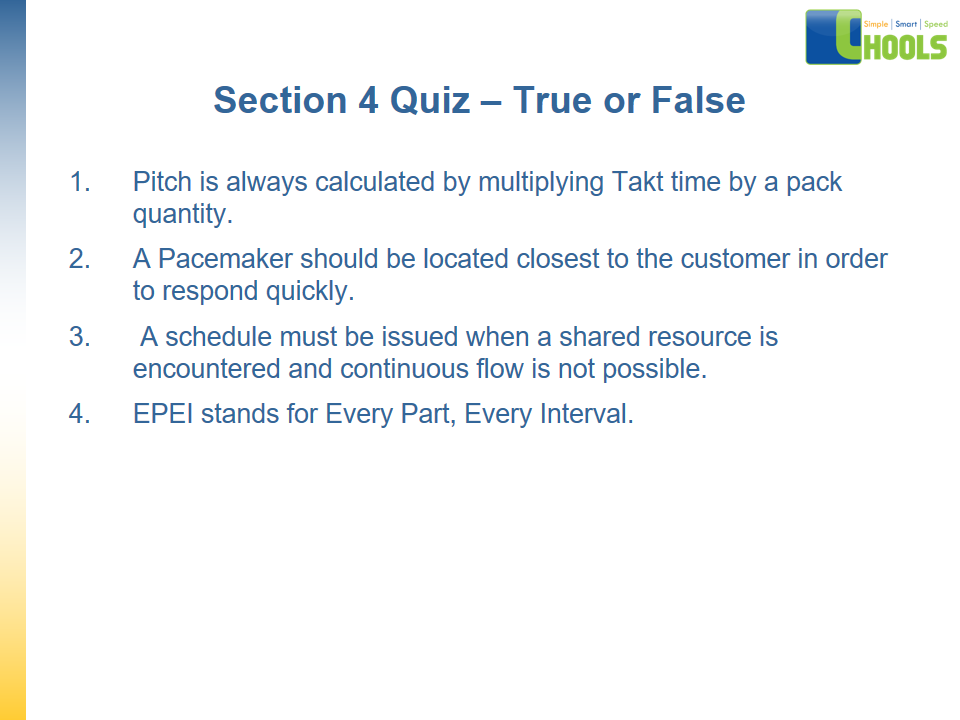
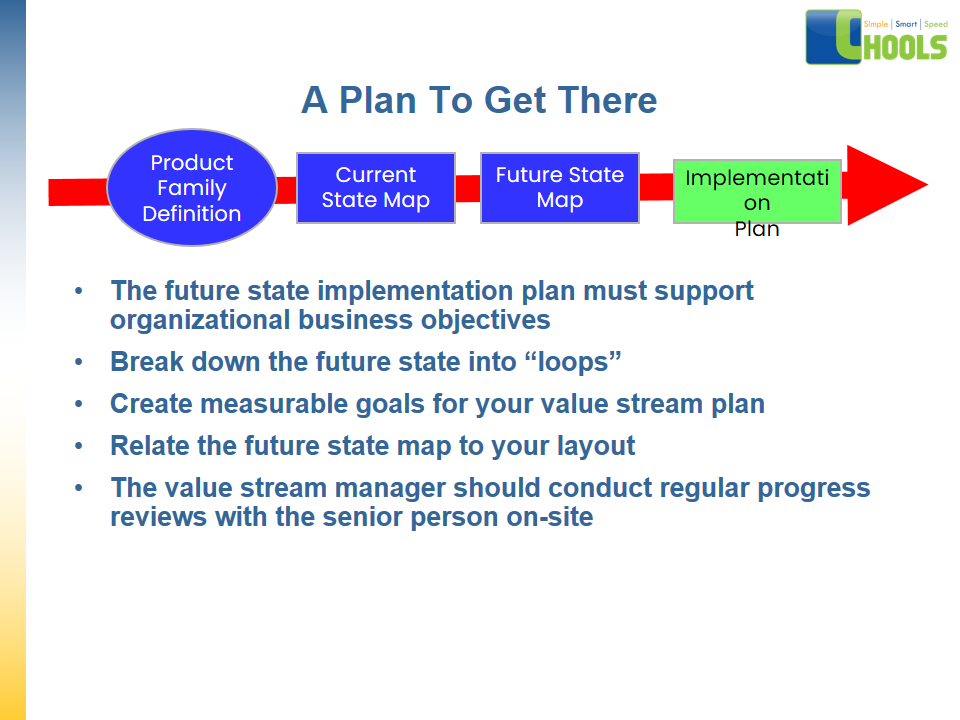
✔ Design the Future State Map.
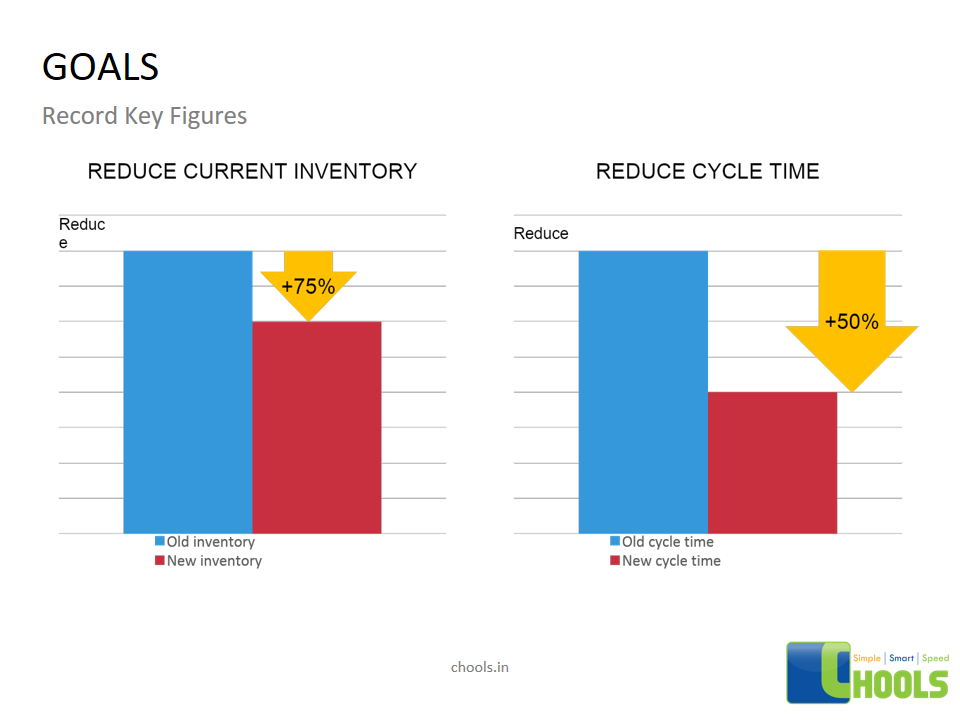
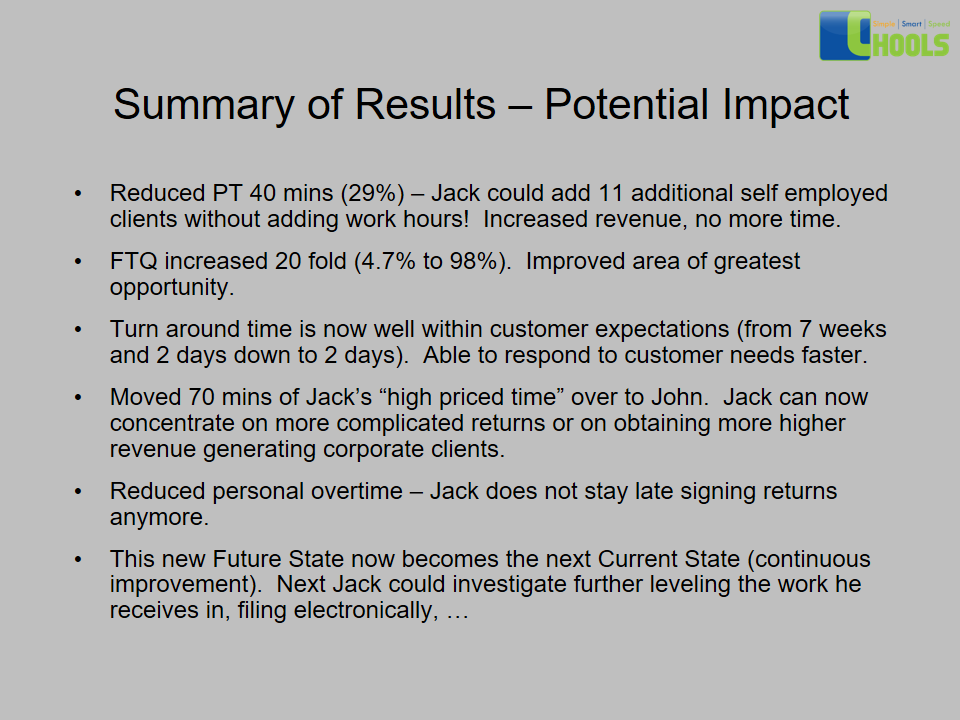
✔ Identify the captured saving $ value.
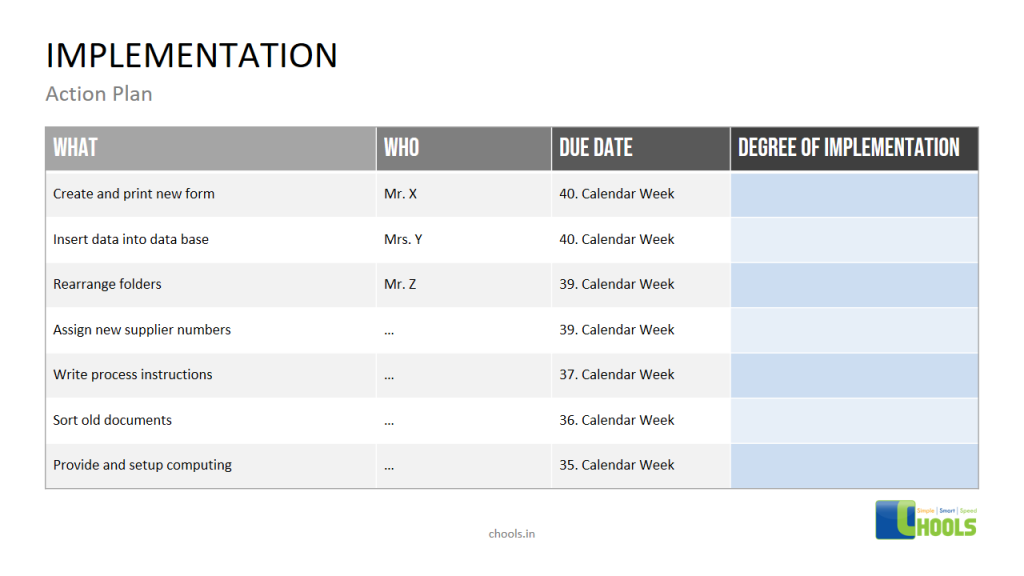
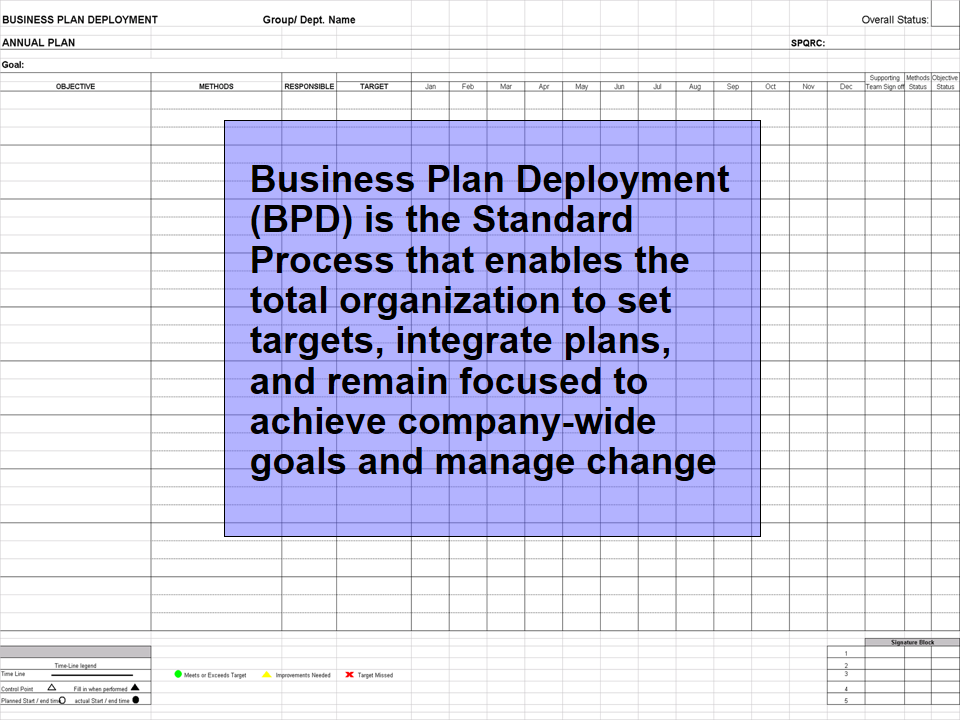
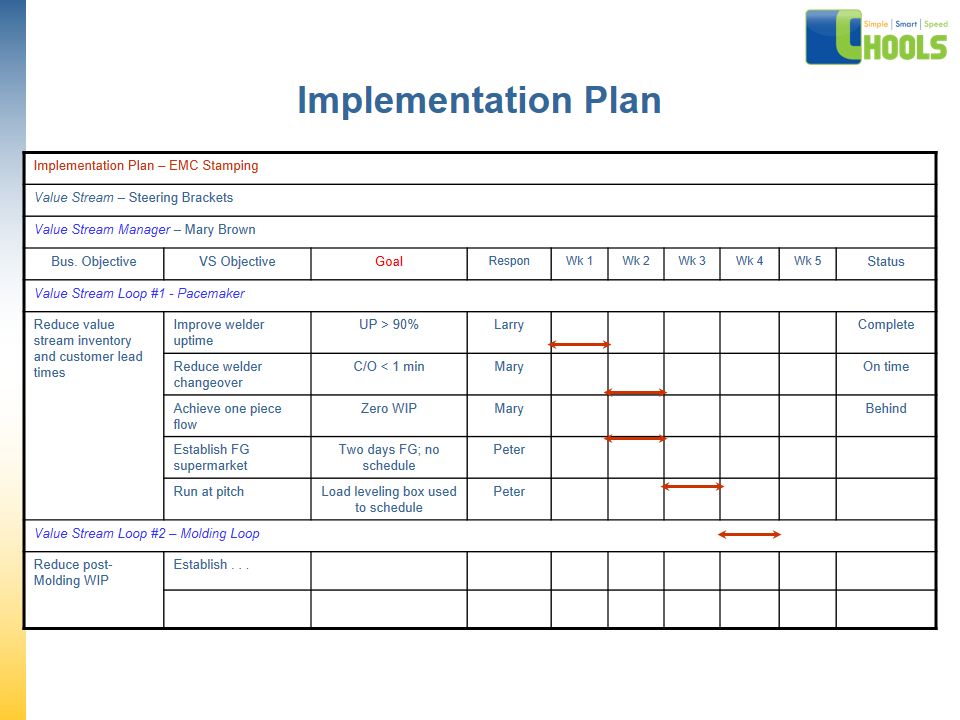
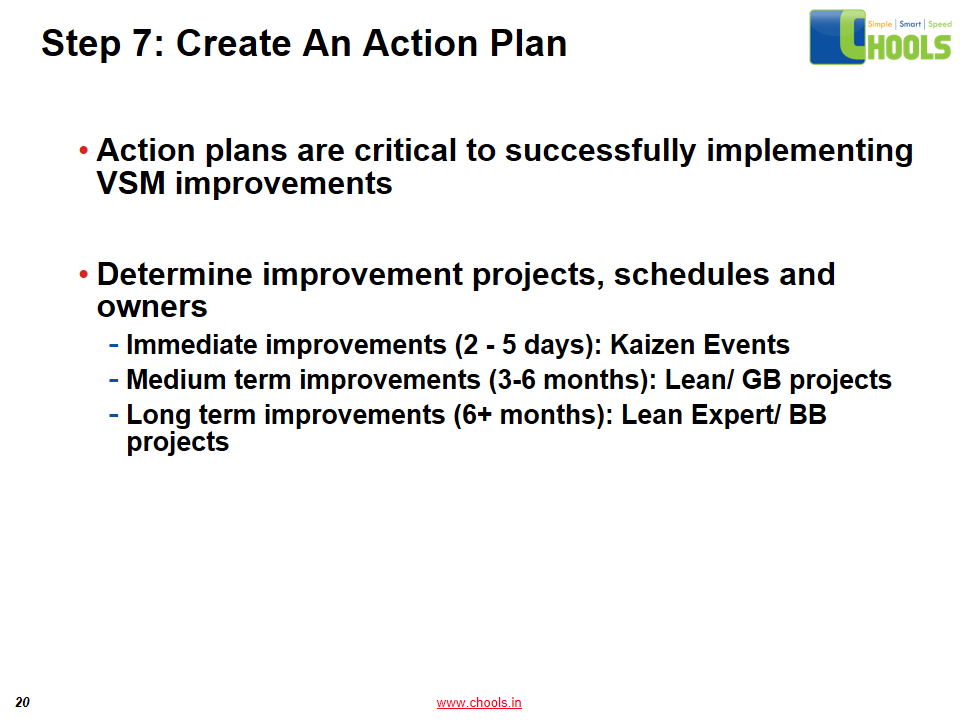
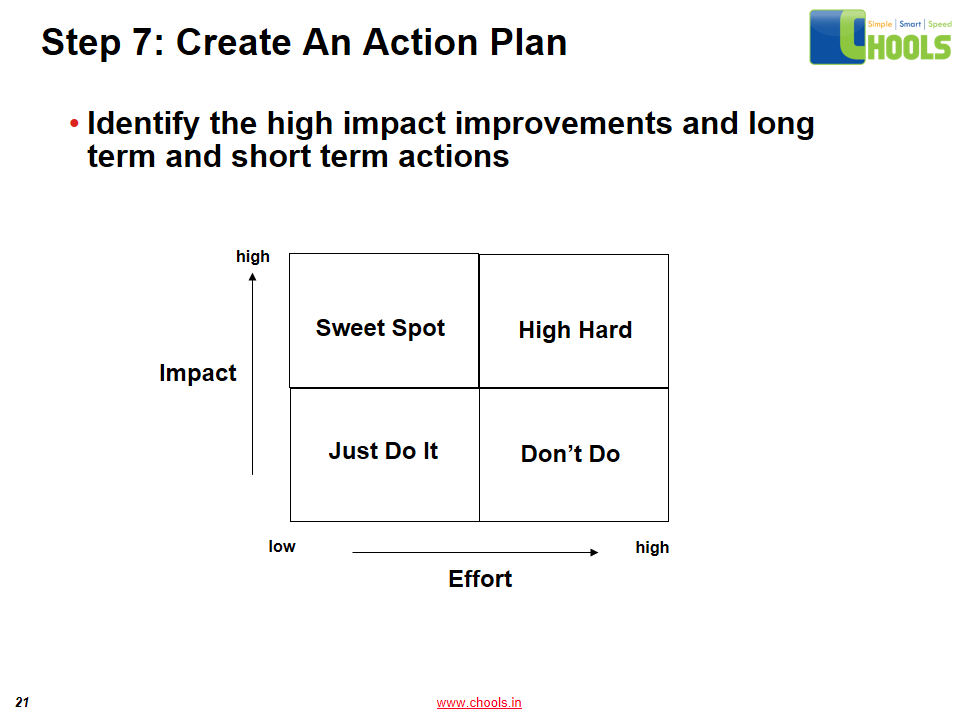
✔ Develop an improvement project plan using Project Management Tools: Project charter, WBS, PERT, CPM, GANNT, RACI model.
✔ Create a Change Management Plan.
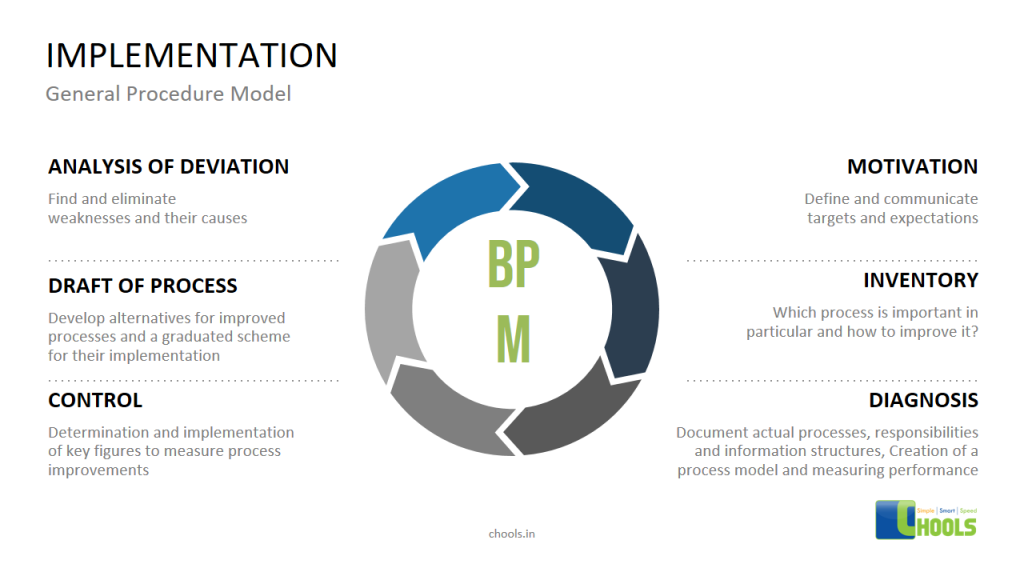
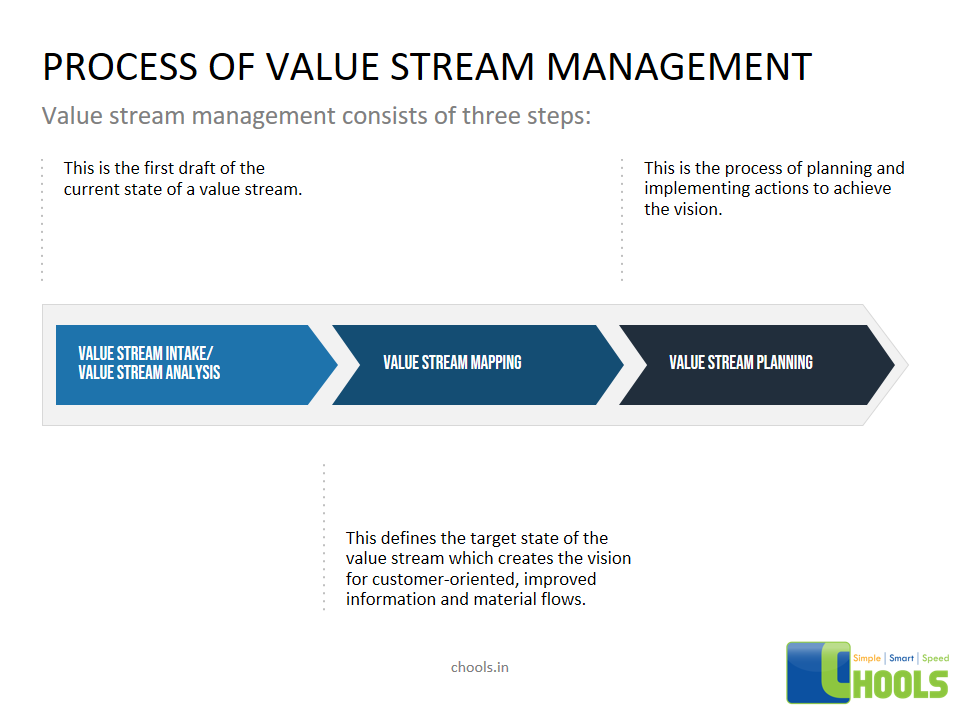
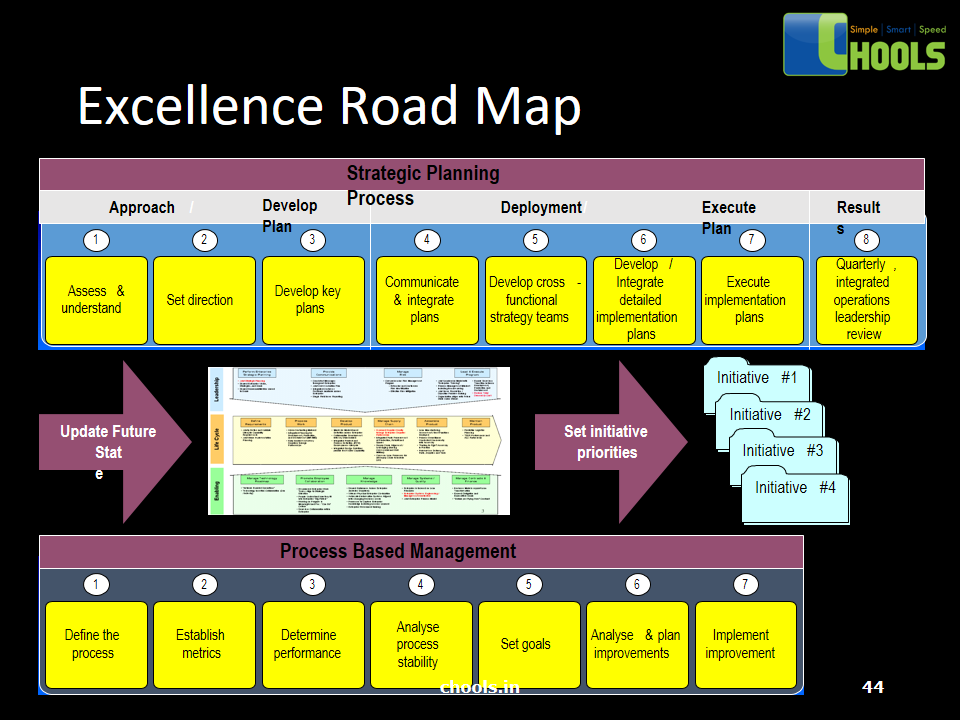
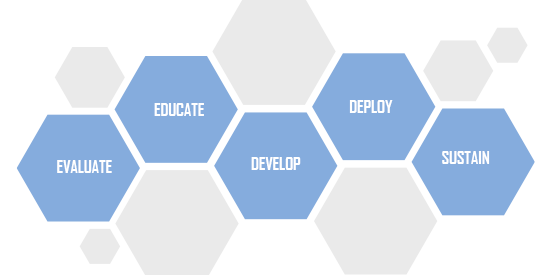
Our approach- HOW:
We will drive world-class end results desired by our clients through

Evaluating
➤ we start with understanding and identifying the selected operations or process and business status quo. Assess the related parameters and identify losses and productivity opportunities.
Educating
➤ Conduct VSM training sessions and related topics, PM, CM, Lean Problem Solving, Design thinking tools.
Developing
➤ Partner with your teams in designing a Future State Map and translate the improvement in $ Value.
Deploying
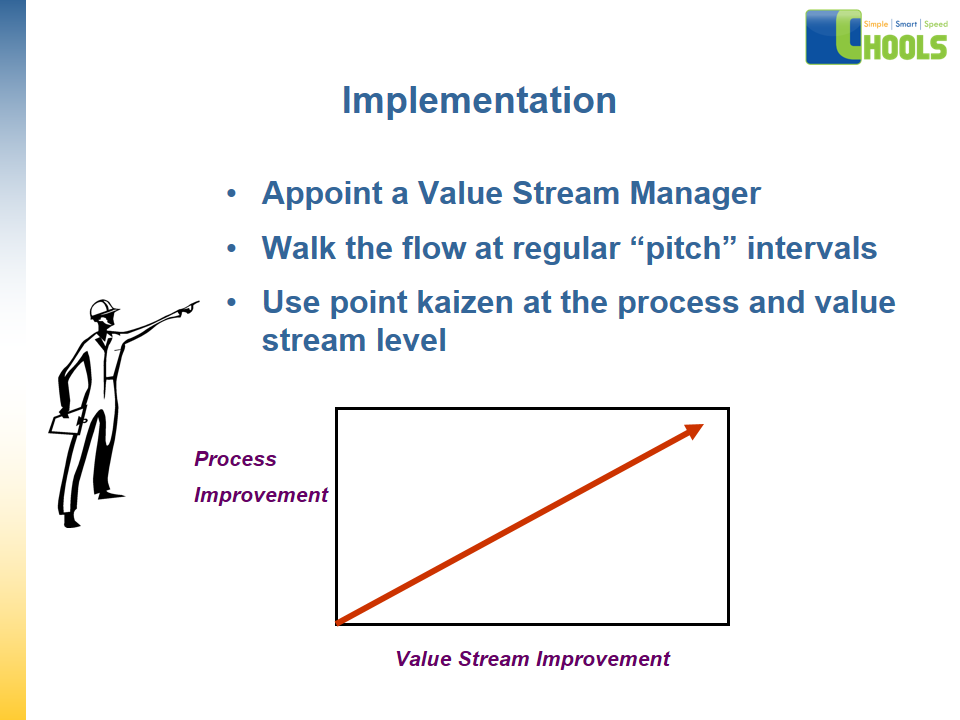
➤ Partner with your team in executing and achieving the set plans.
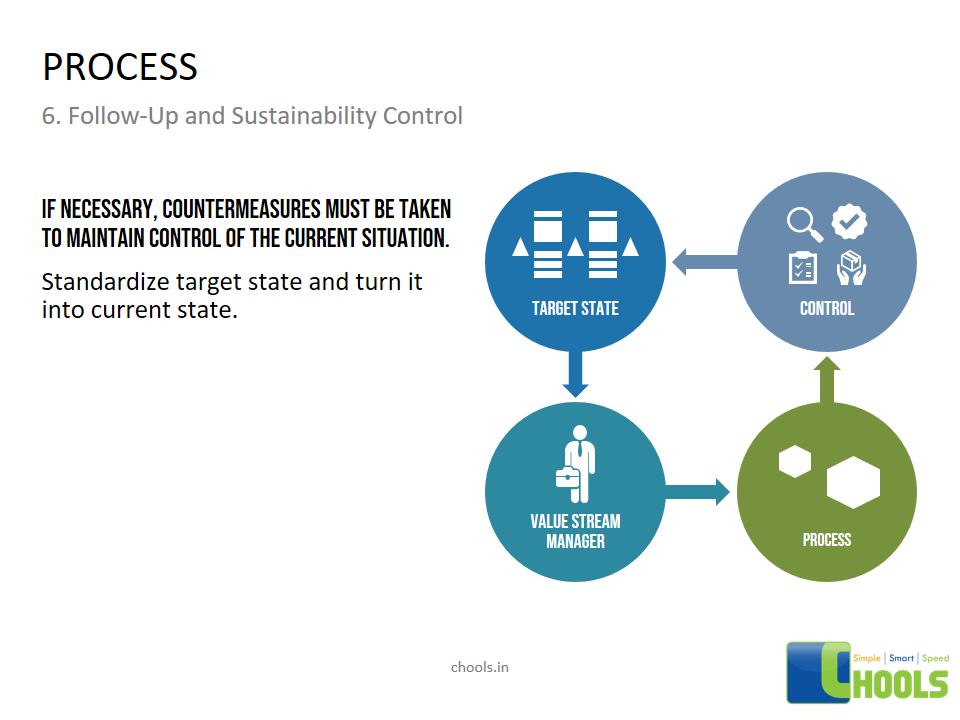
Sustaining
➤ Partner with your teams in putting sustainability and continuous improvement plans for the Future State Map.
➤ Time frame for each phase depends on process/ operation selected.
Case
A Liquid Hand Soap Manufacturer with an annual production of 255MM tons started observing a decline in its Sales revenue. The company was aiming to increase its revenue and increase its profitability through driving cost reduction and continuous improvement initiatives. Our team started with conducting a Deep Dive followed by a Value Stream Mapping event for Sales and Distribution processes as it was identified as the biggest opportunity for improvement. The revenue model, Market channels, Profit and Loss, Sales and Distribution costs were analyzed. Benchmarking with other affiliates and comparing the actual $/Case vs. the Annual Operating Plan ( 0.13$/Cs vs 0.1$/CS) were preceding simulating the processes.
Solution
Through the Value Stream mapping event on the S&D processes. The following was identified and solved for:
Truck Loading Process exceeds standard time by 30min causing delivery time delays and an inaccuracy in product loading causing costumers’ loss and additional markets routes.
➤ 3 Forks Forklifts were used instead to carry two pallets vs. One.
➤ Trucks were modified to carry more pallets.
➤ Automation of PO process by introducing ERP/SAP that connected all stakeholders, customers, manufacturing operations and vendors, warehouses and sales and distribution. This drove accuracy in recording customers’ orders and instant visibility to the orders by the Warehouses team giving time for order preparation and reducing human error in communicating the order and manual papers.
➤ Elimination of the Gate inspection process reducing time of delivery.
➤ Training of loading warehouse team to meet criteria of loading.
➤ Optimization of truck delivery routes and scheduling based on geography, which also reduced fuel costs.
➤ Introduce a tool for unloading cases from truck to customer to reduce the time, enhance ergonomics.
➤ Enhance product storage and 5S in the Warehouses for easy and speedy allocation of product by forklift drivers loading trucks.
Results
Over a course of a year, the producer increased its Sales revenue by 22%, reduced the total $Cost /case by 11% and met the AOP for S&D cost of $0.1 $/case. In addition, Employee productivity Case/EE-Hr increased by 31% and initiatives enhanced Employee Safety related to Ergonomics.
Case
A leading Plastic bottled (PET) Pure Water producer hired Chools to increase its profitability through cost reduction initiatives and CI events. Post analyzing the profit and loss and the various cost buckets, Electricity consumptions hitting the Manufacturing overheads expenses was seen as a huge opportunity of improvement.
Solution
The Value Stream Mapping event simulated all production lines and utility plants with all electricity consumptions including compressors, boilers, cooling towers, filling line equipment, water treatment plant equipment, bottle blow molders.
The following solution were identified based on a Mass balance:
➤ Replace current high-pressure compressors with a Slave mode compressor.
➤ Replace all lighting with LED lightings
➤ Replace WH Roof with skylight roof.
➤ Resolve the Top three OEE contributors.
➤ Replace blowers on line with Vacuum instead of compressed air.
➤ Optimize the blowing pressure on the Bottle blow molding machines, which are one of the highest electricity consumers.
➤ A long-term project was studied with a third party company to install Photovoltaic cells to replace nonrenewable energy resource with renewable.
Results
Over a course of a year and execution of the suggested plan, the producer reduced its electrical consumption by 40% from 0.31KWHR/8OZ to 0.18 translated to a $1.2MM Net productivity savings.
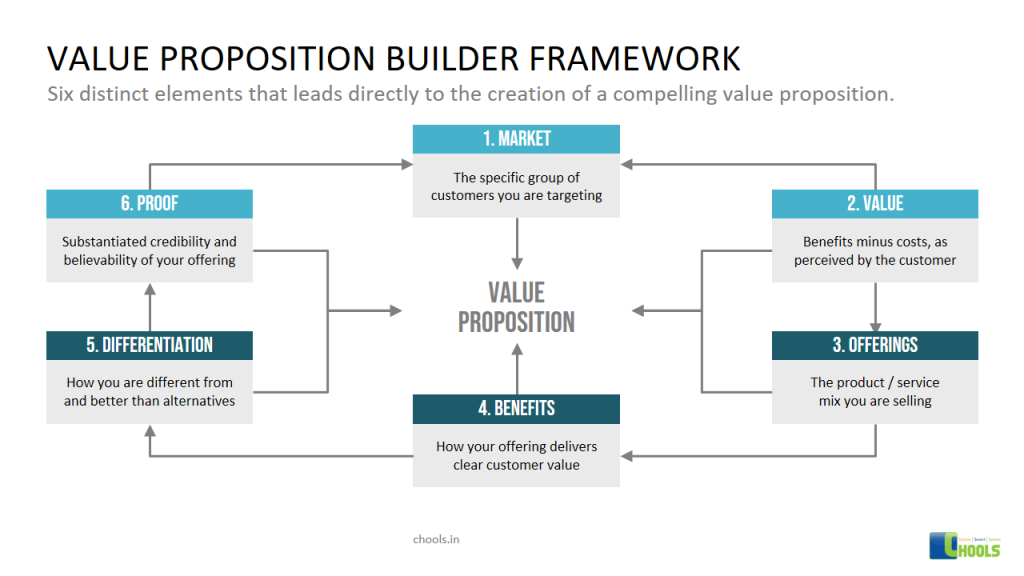
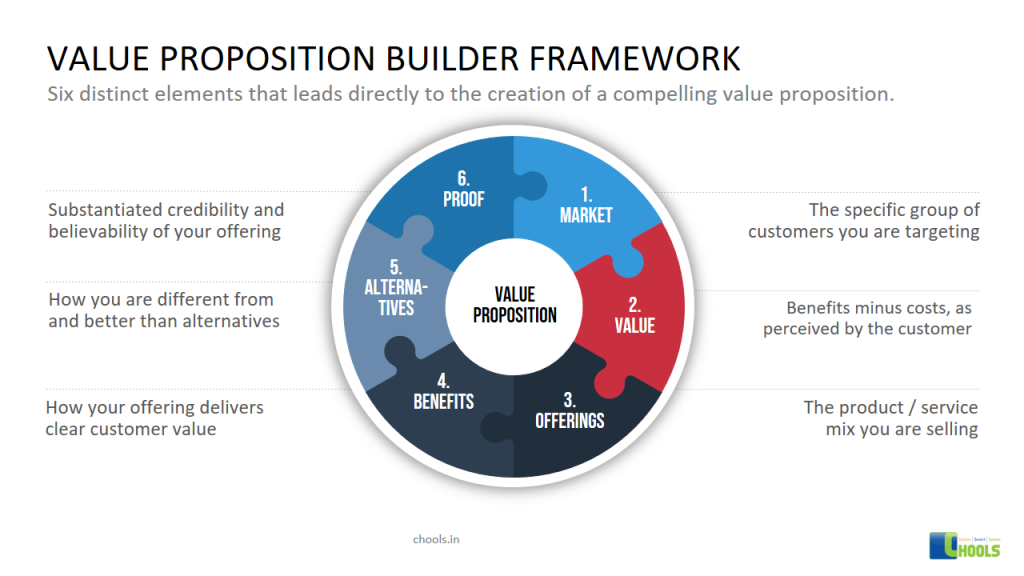
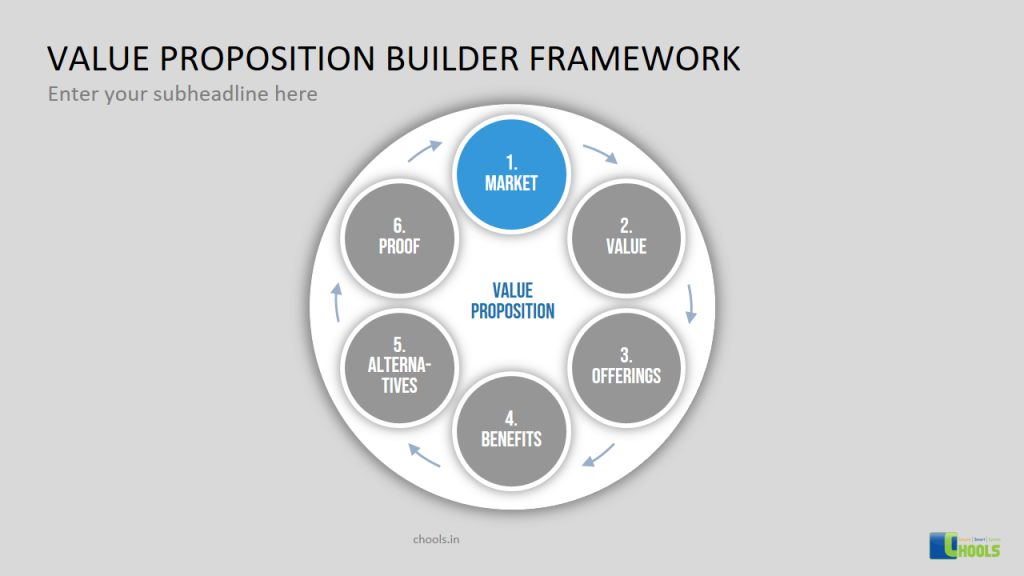
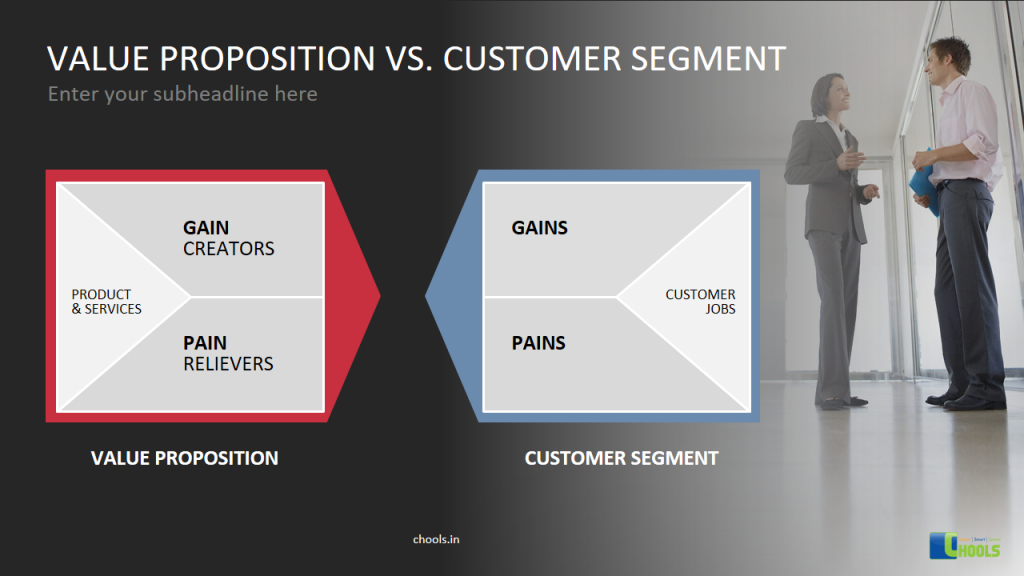
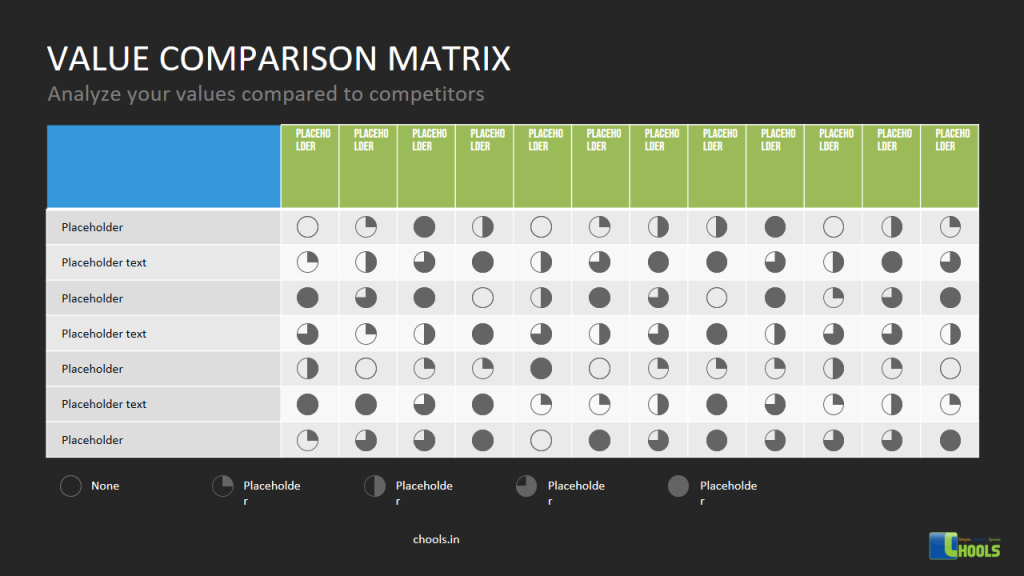
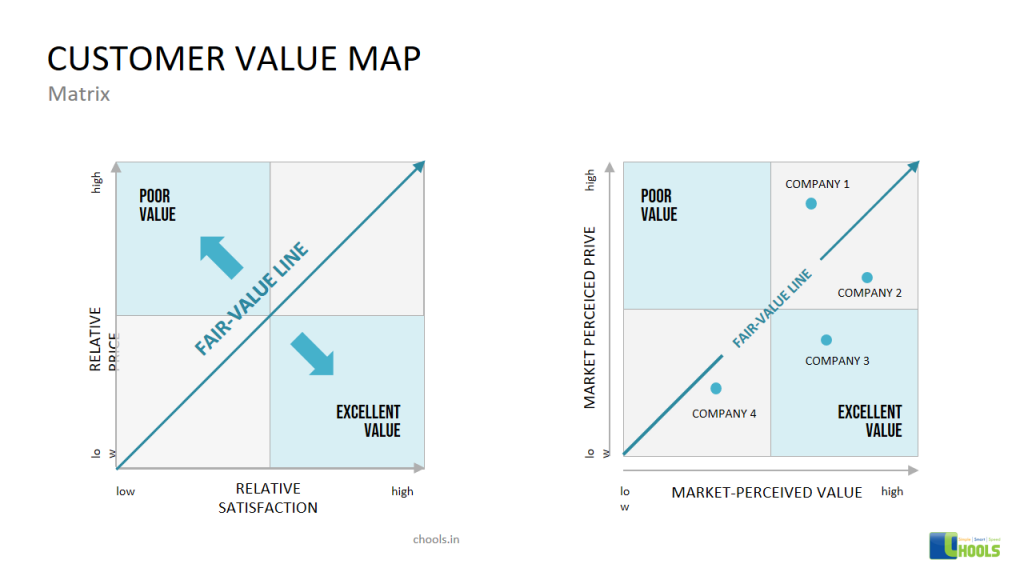
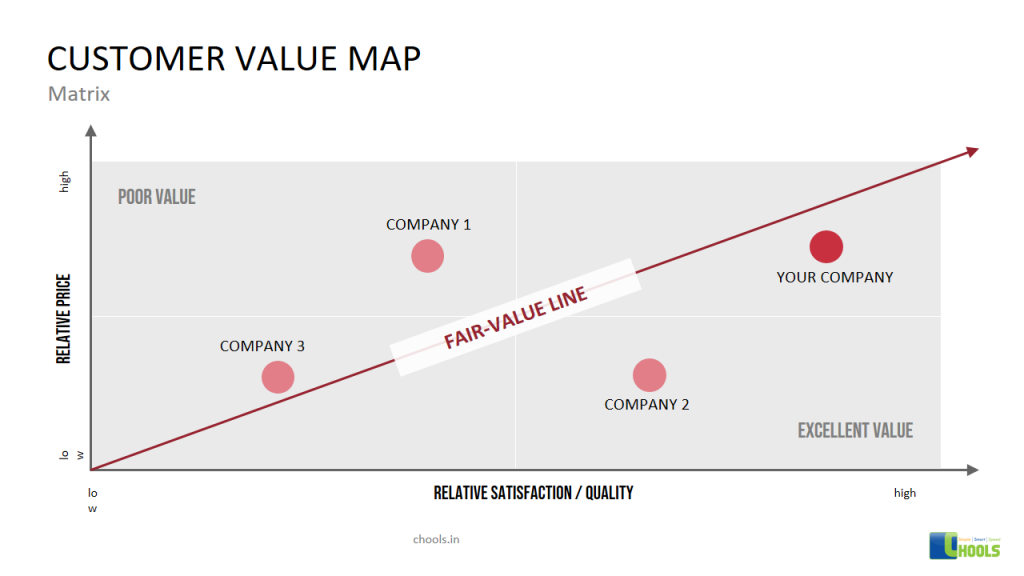
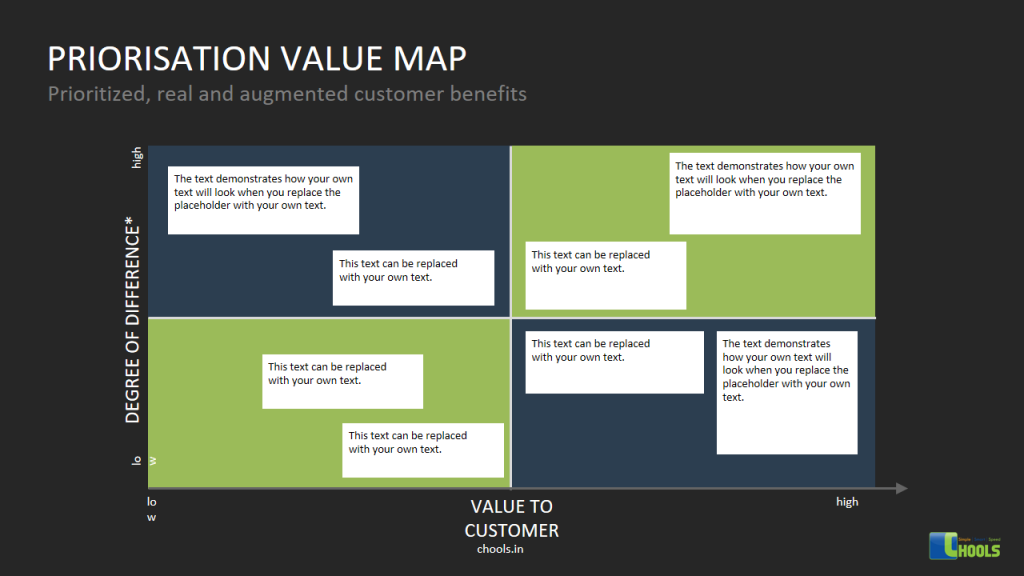
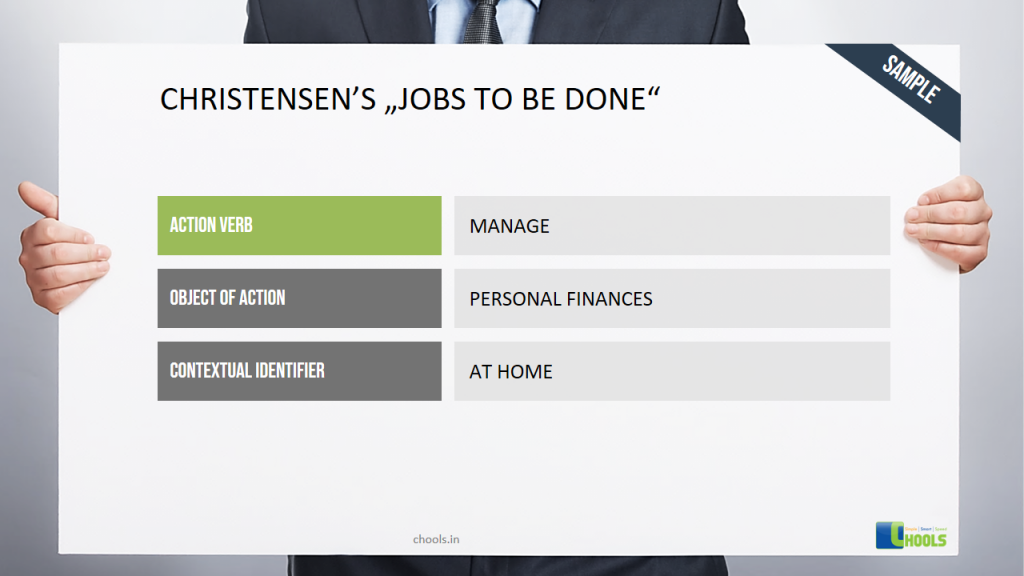
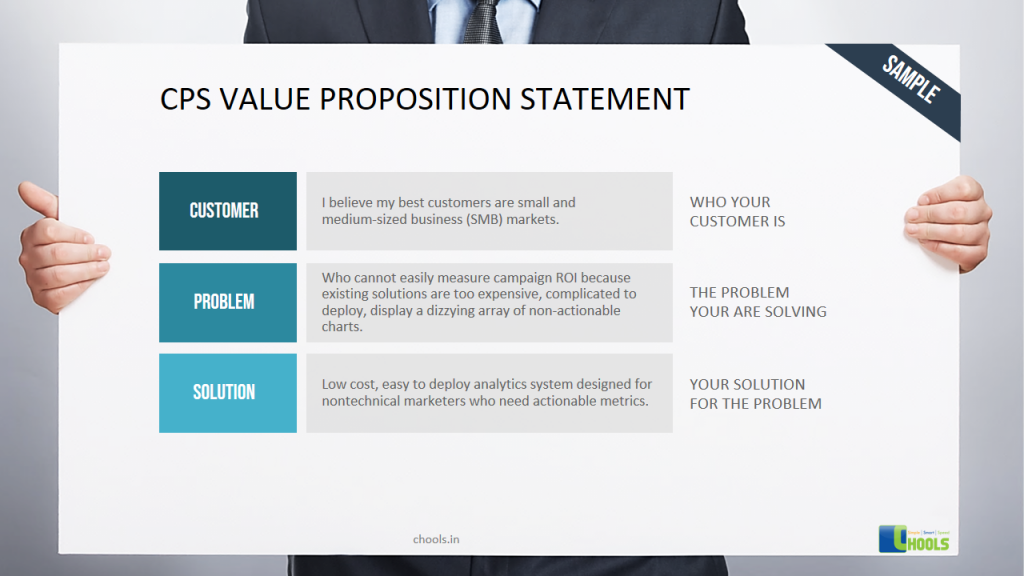
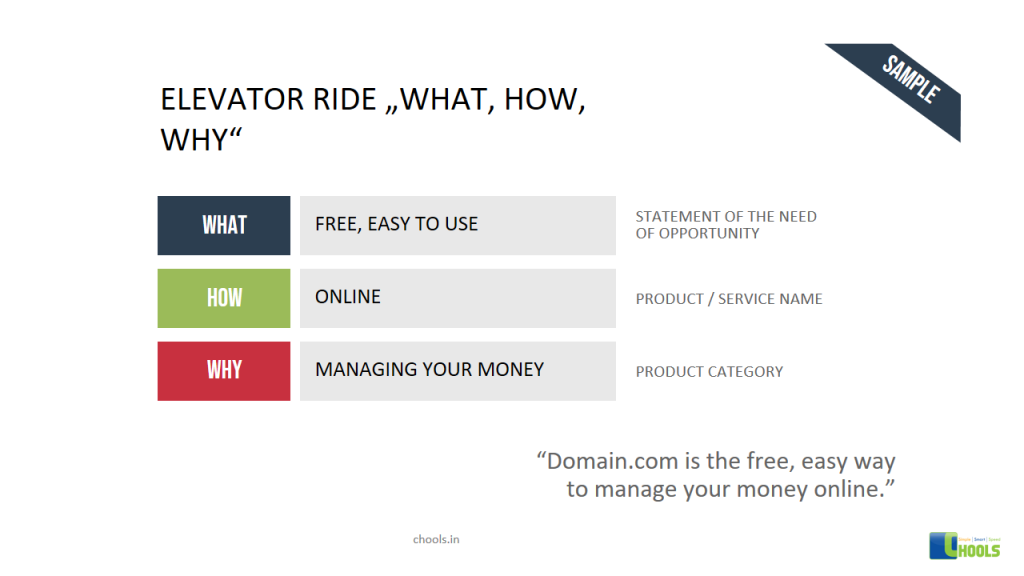
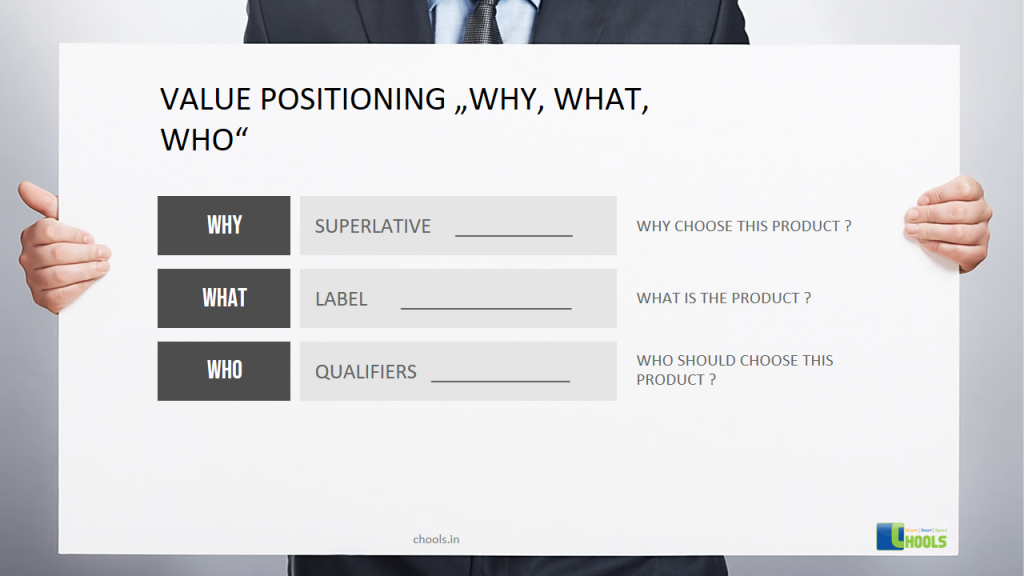
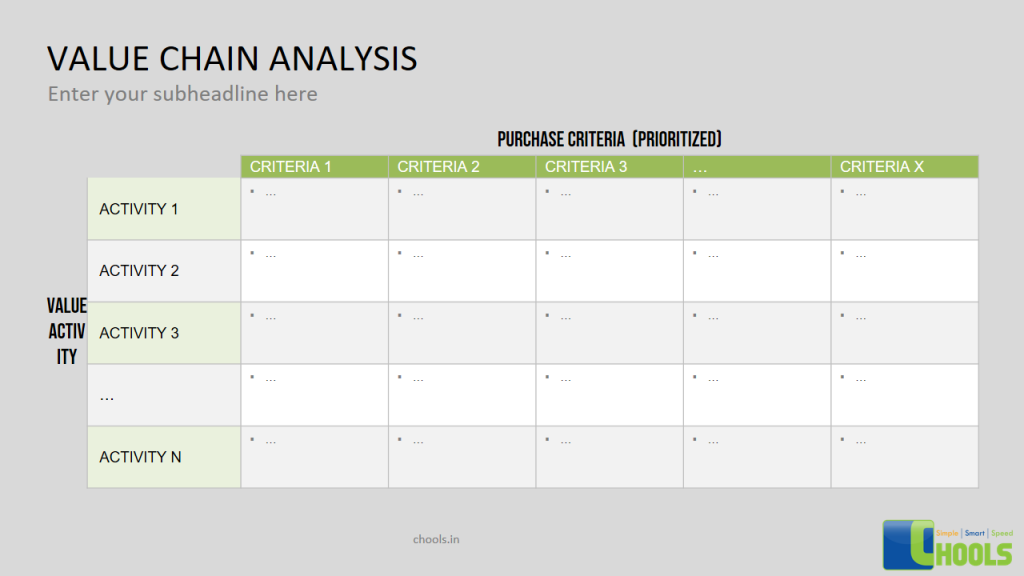
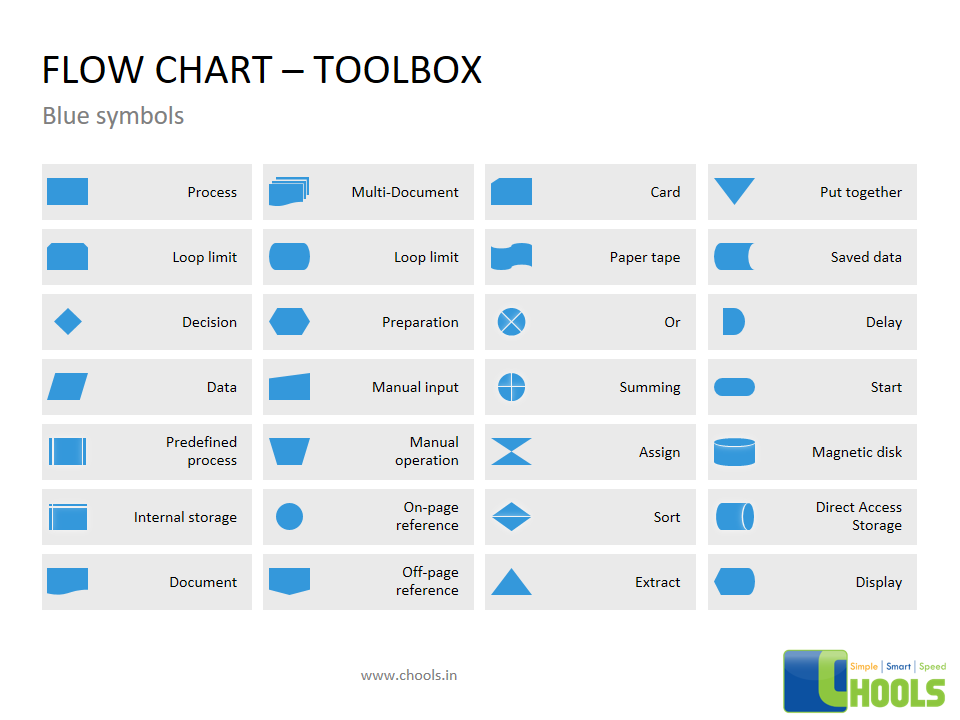
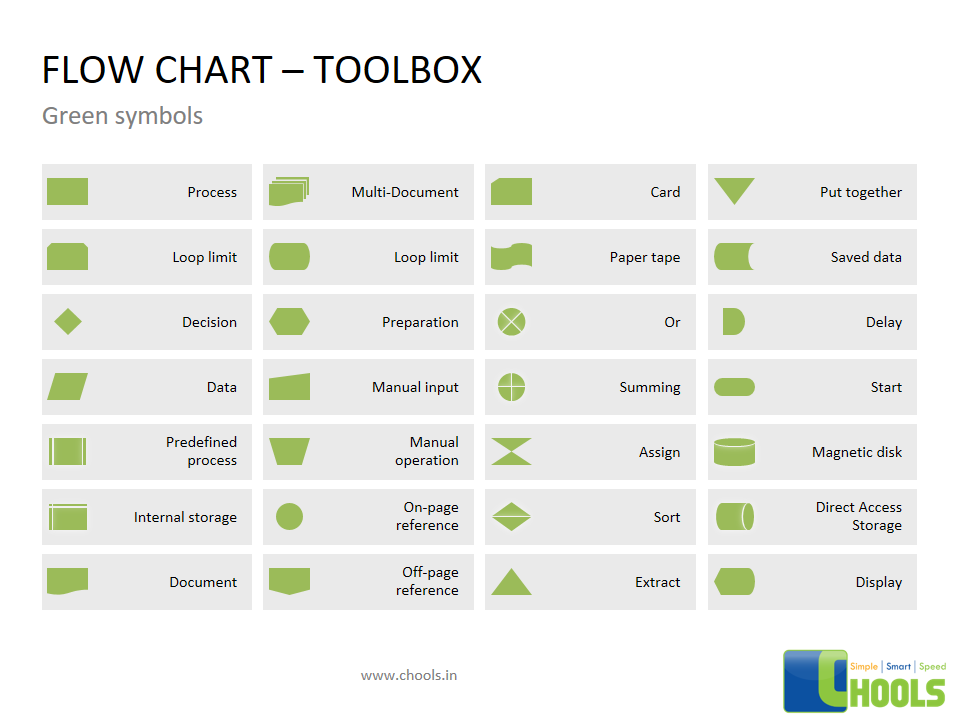
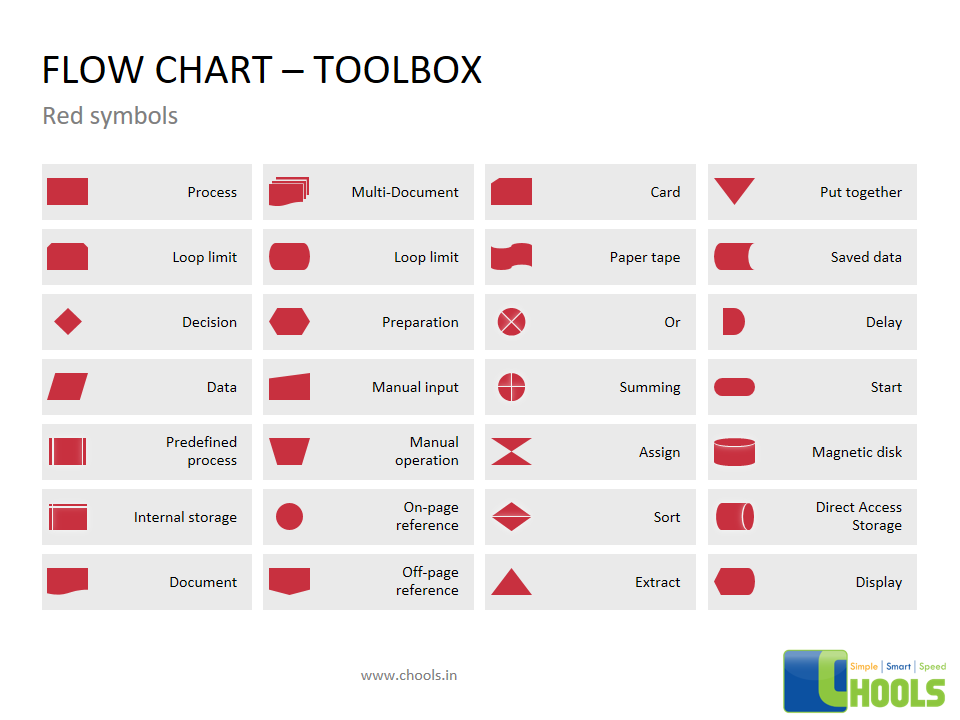
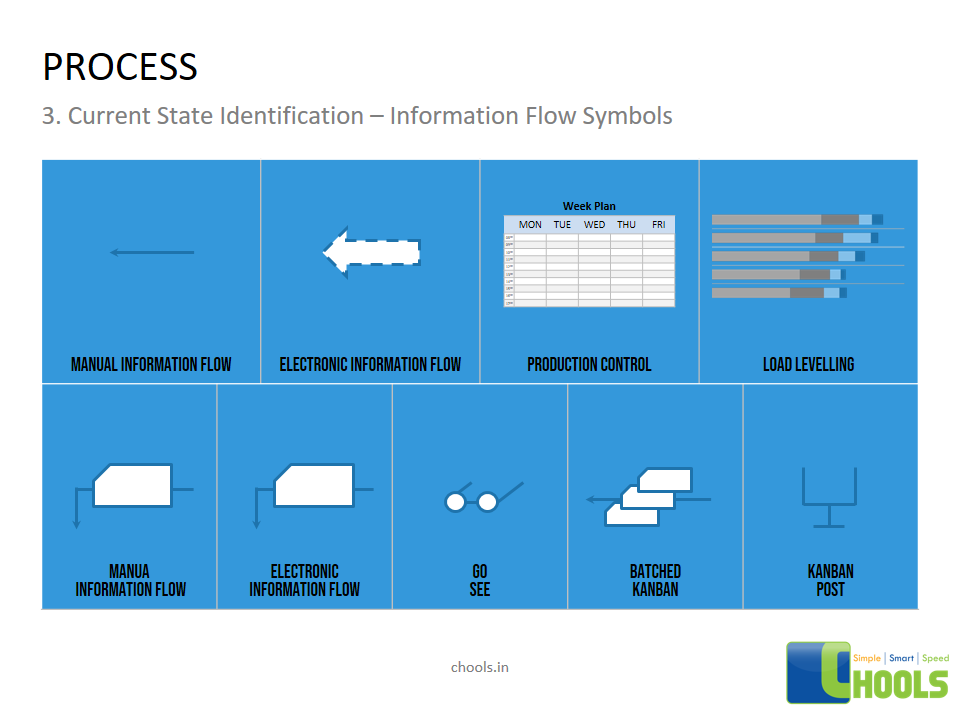
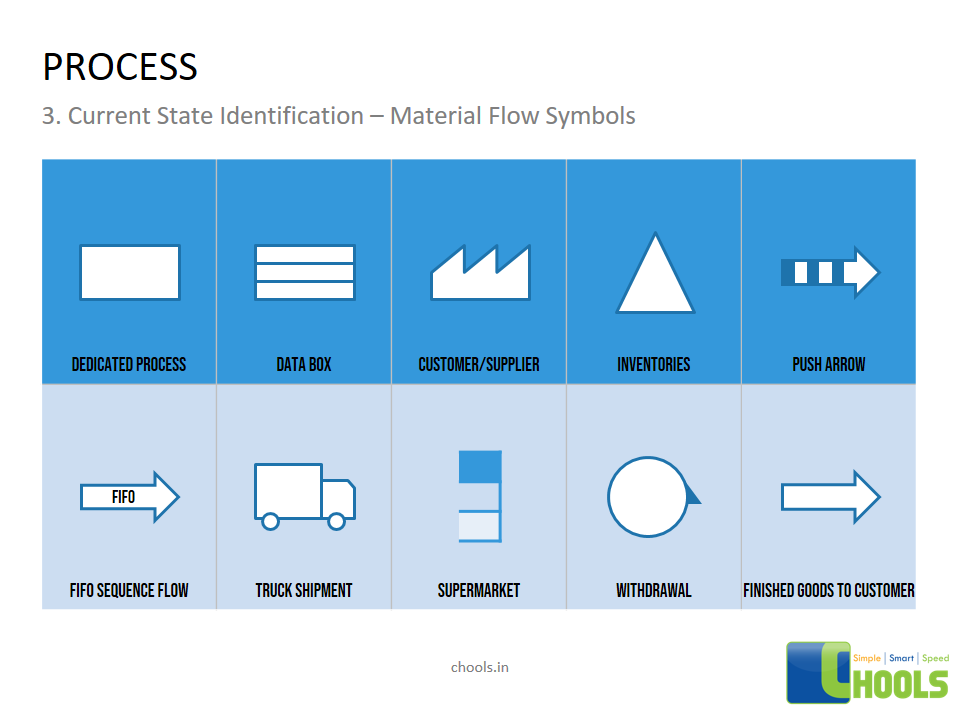
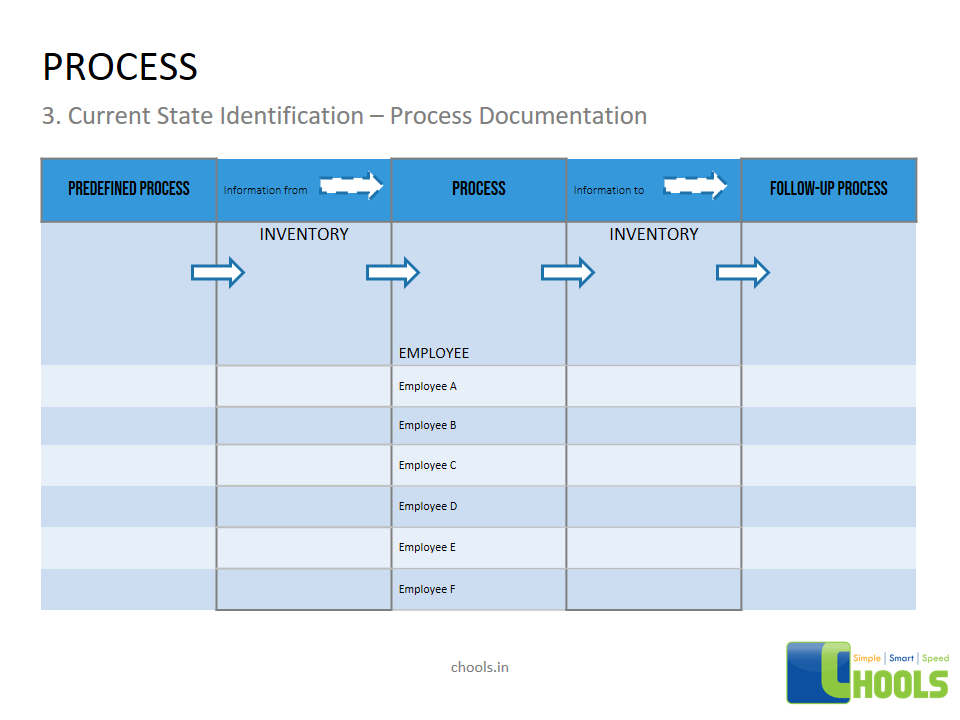
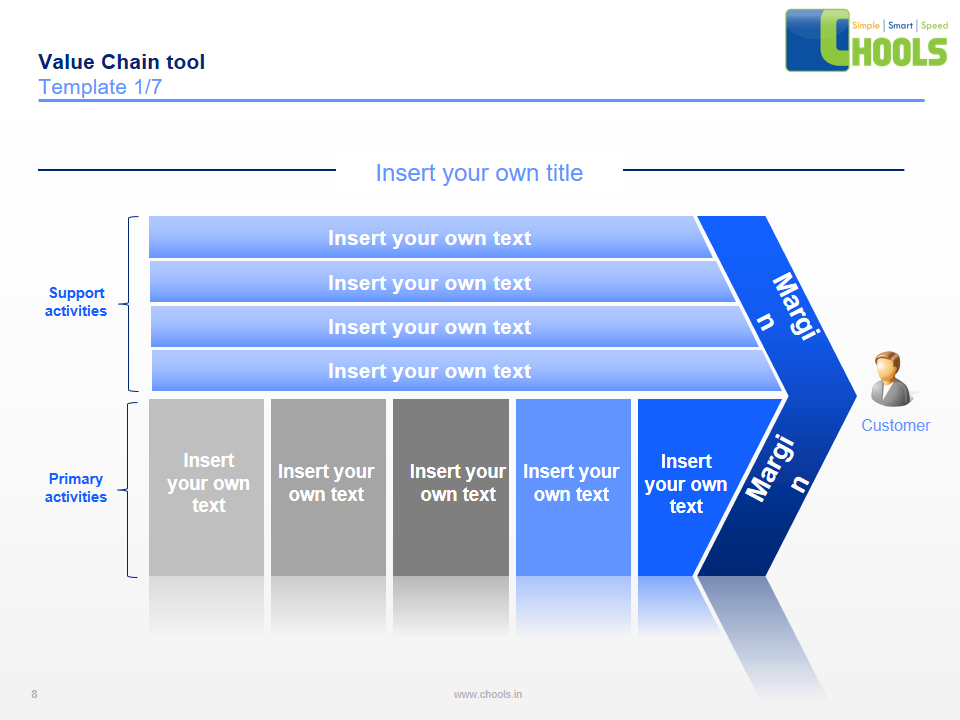
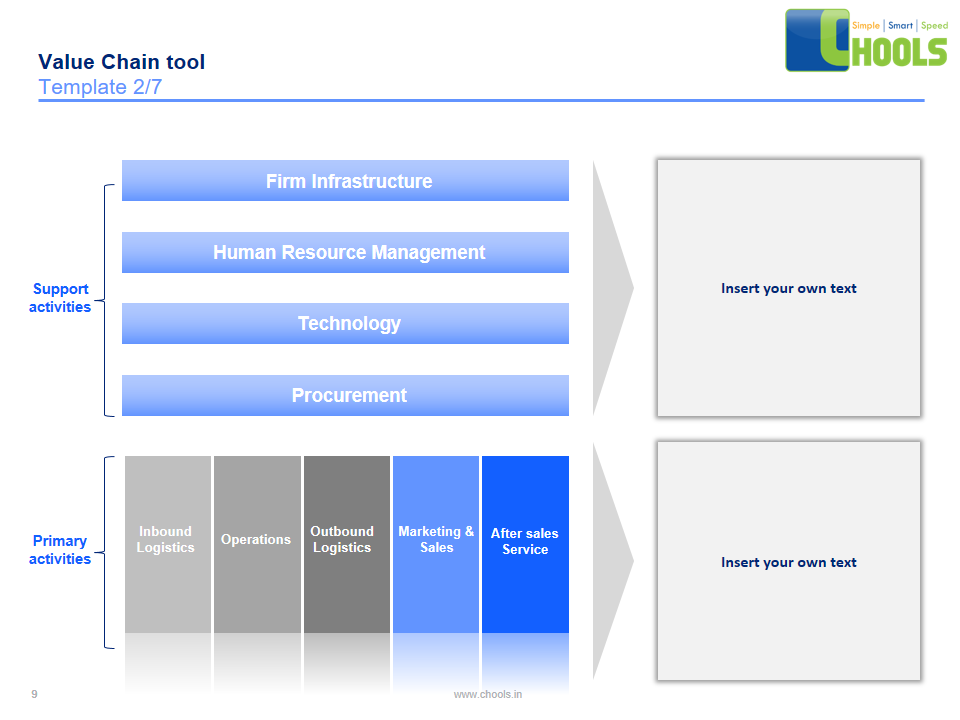
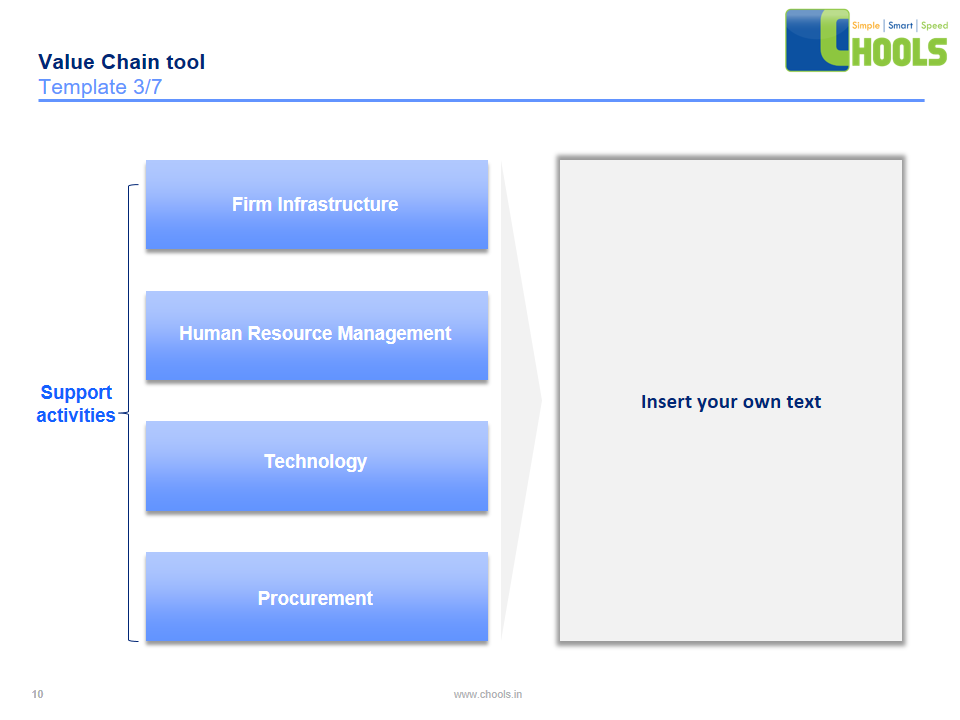
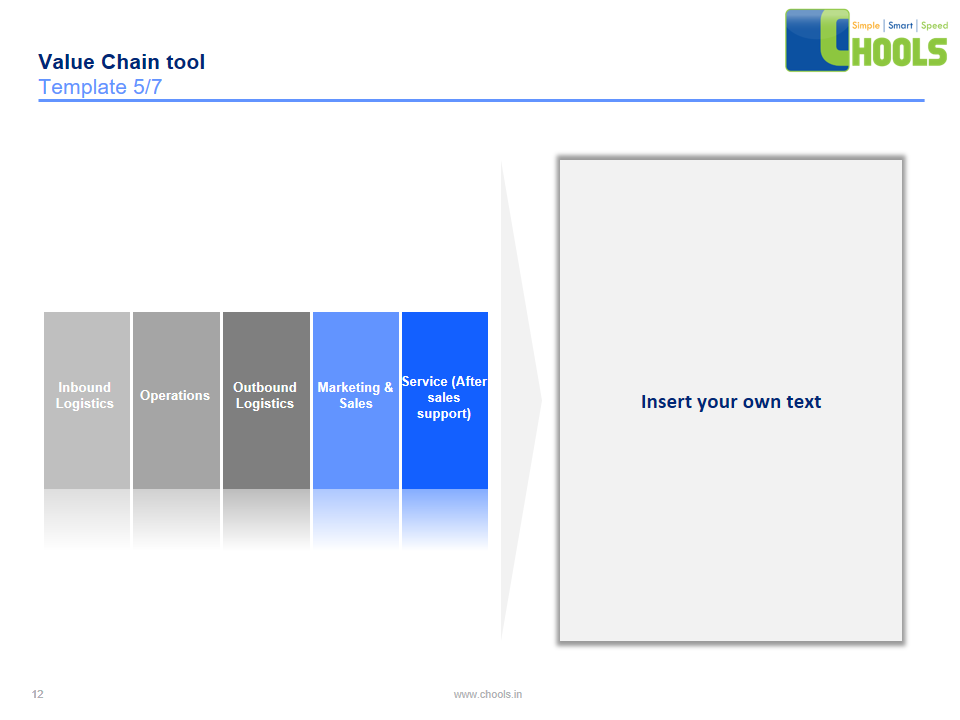
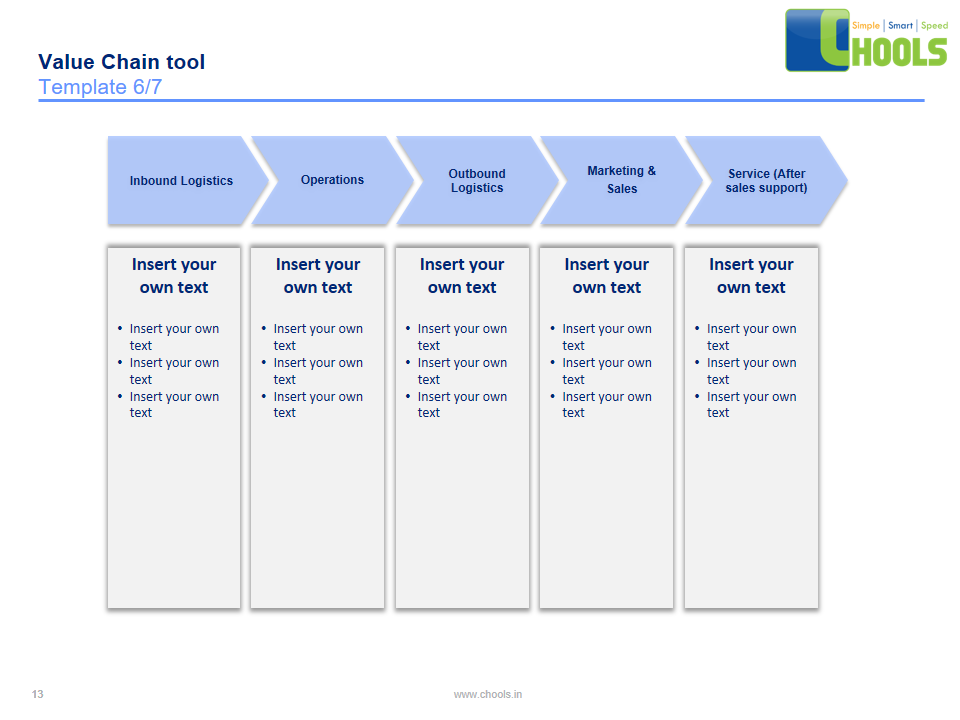
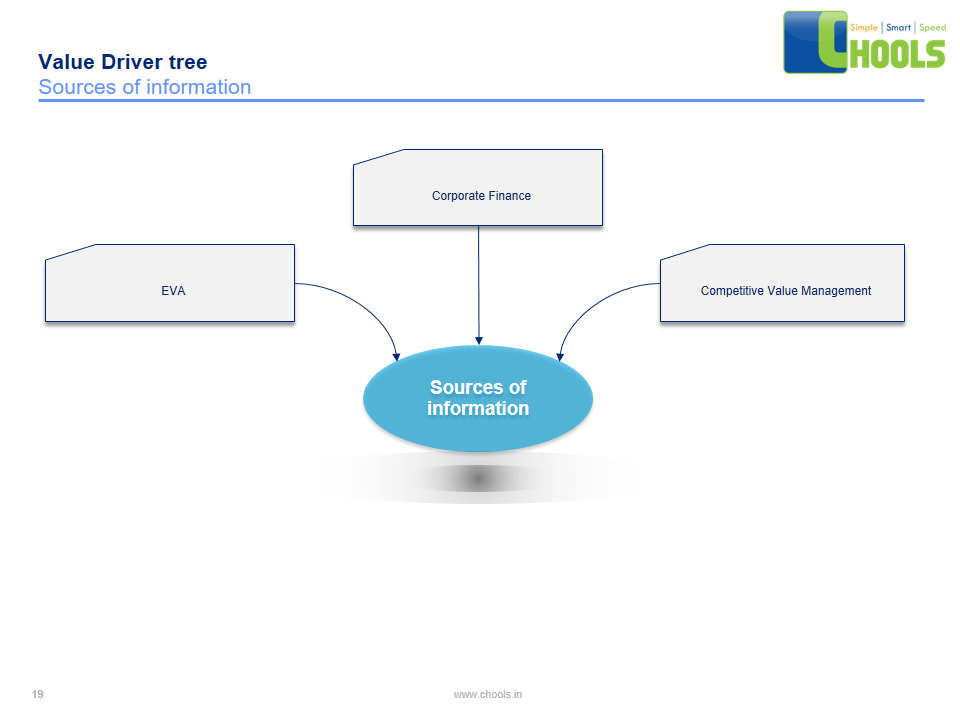
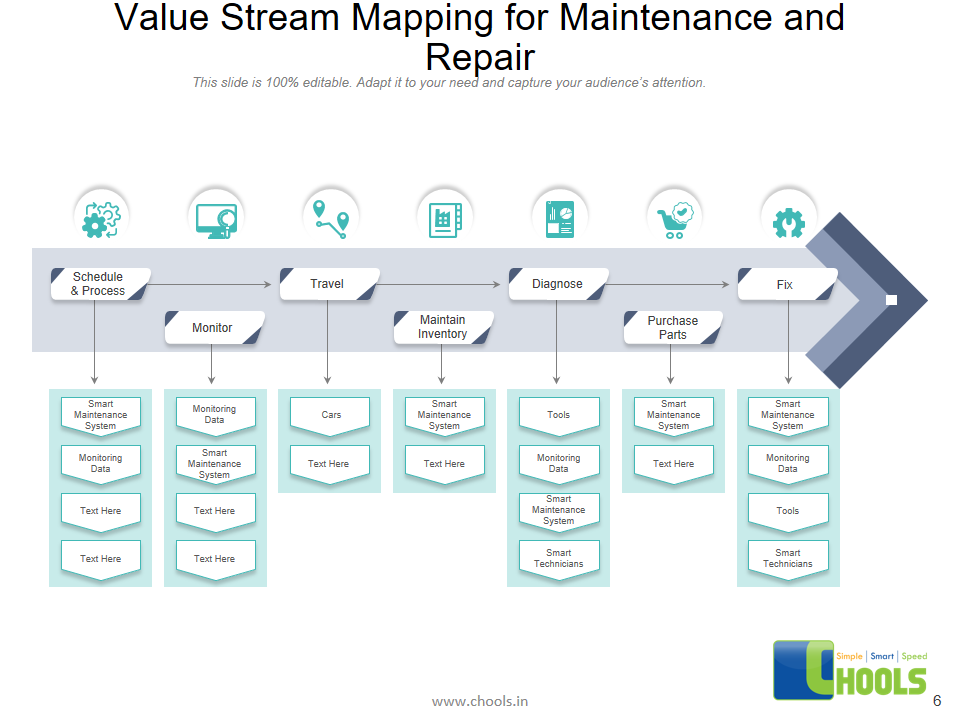
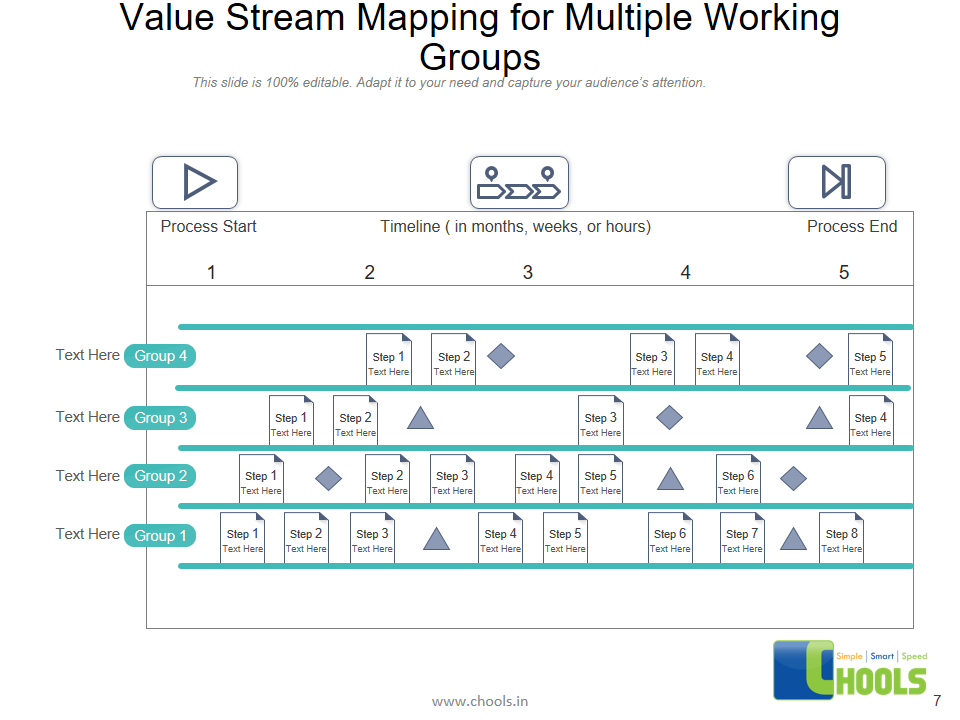
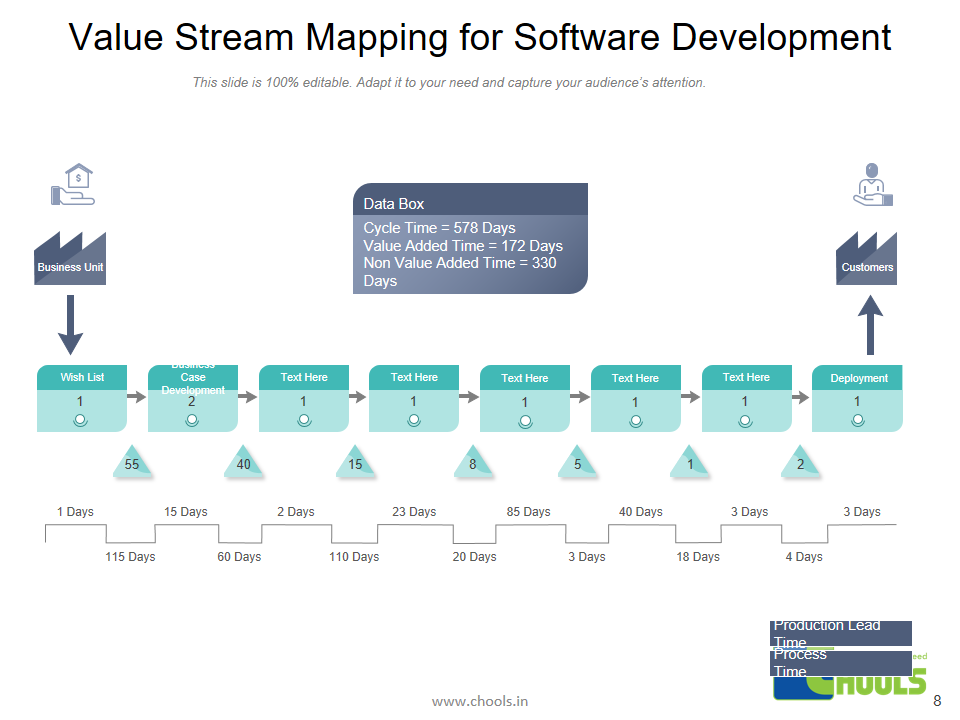
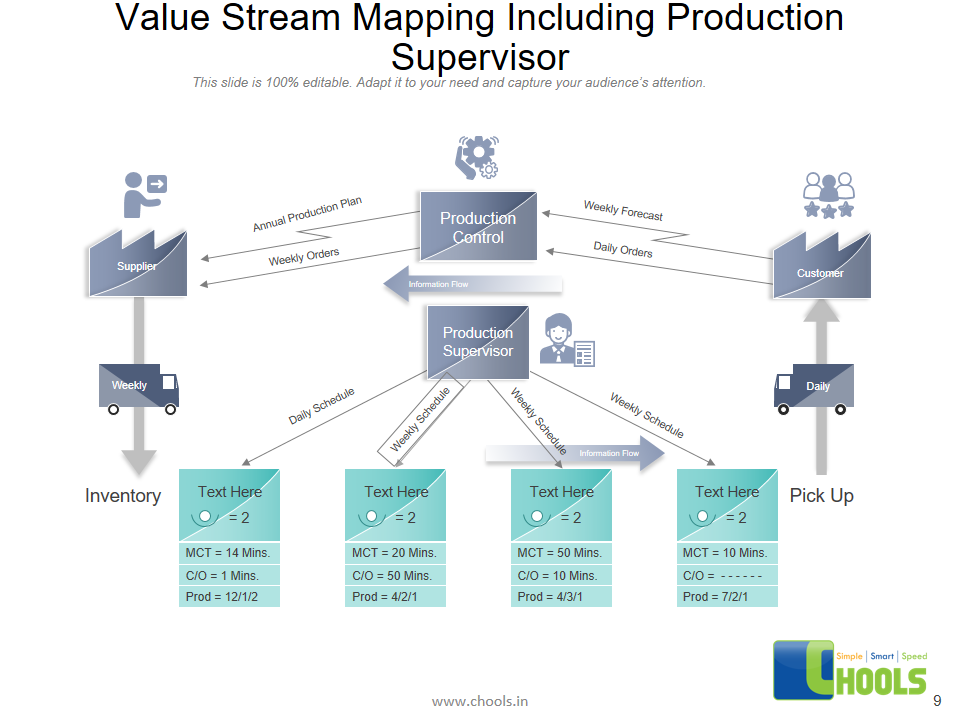
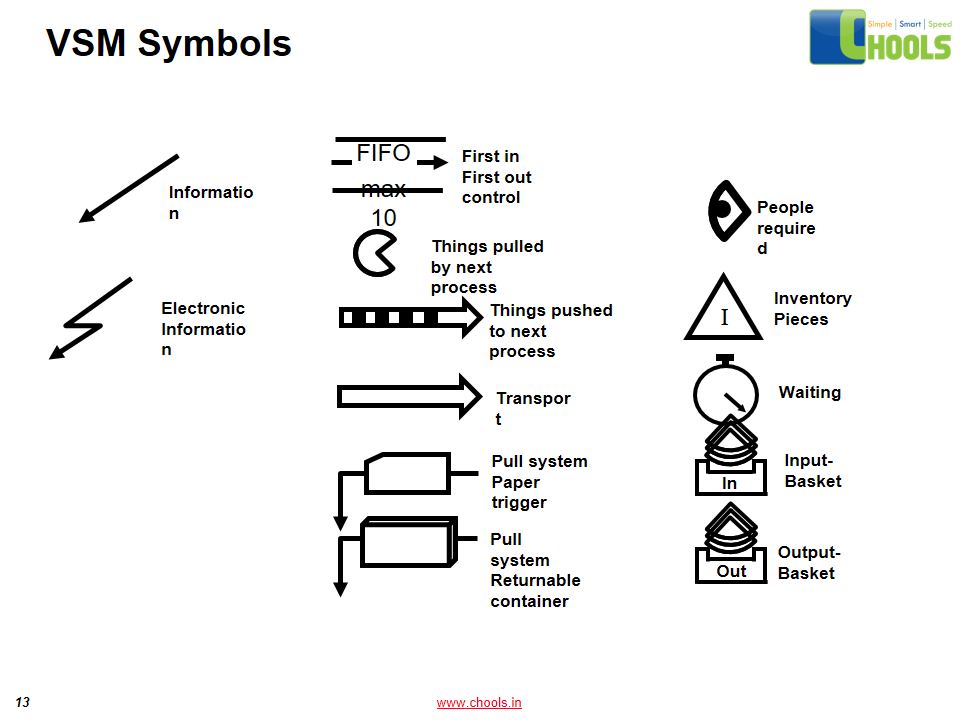
VALUE STREAM MAPPING TEMPLATES